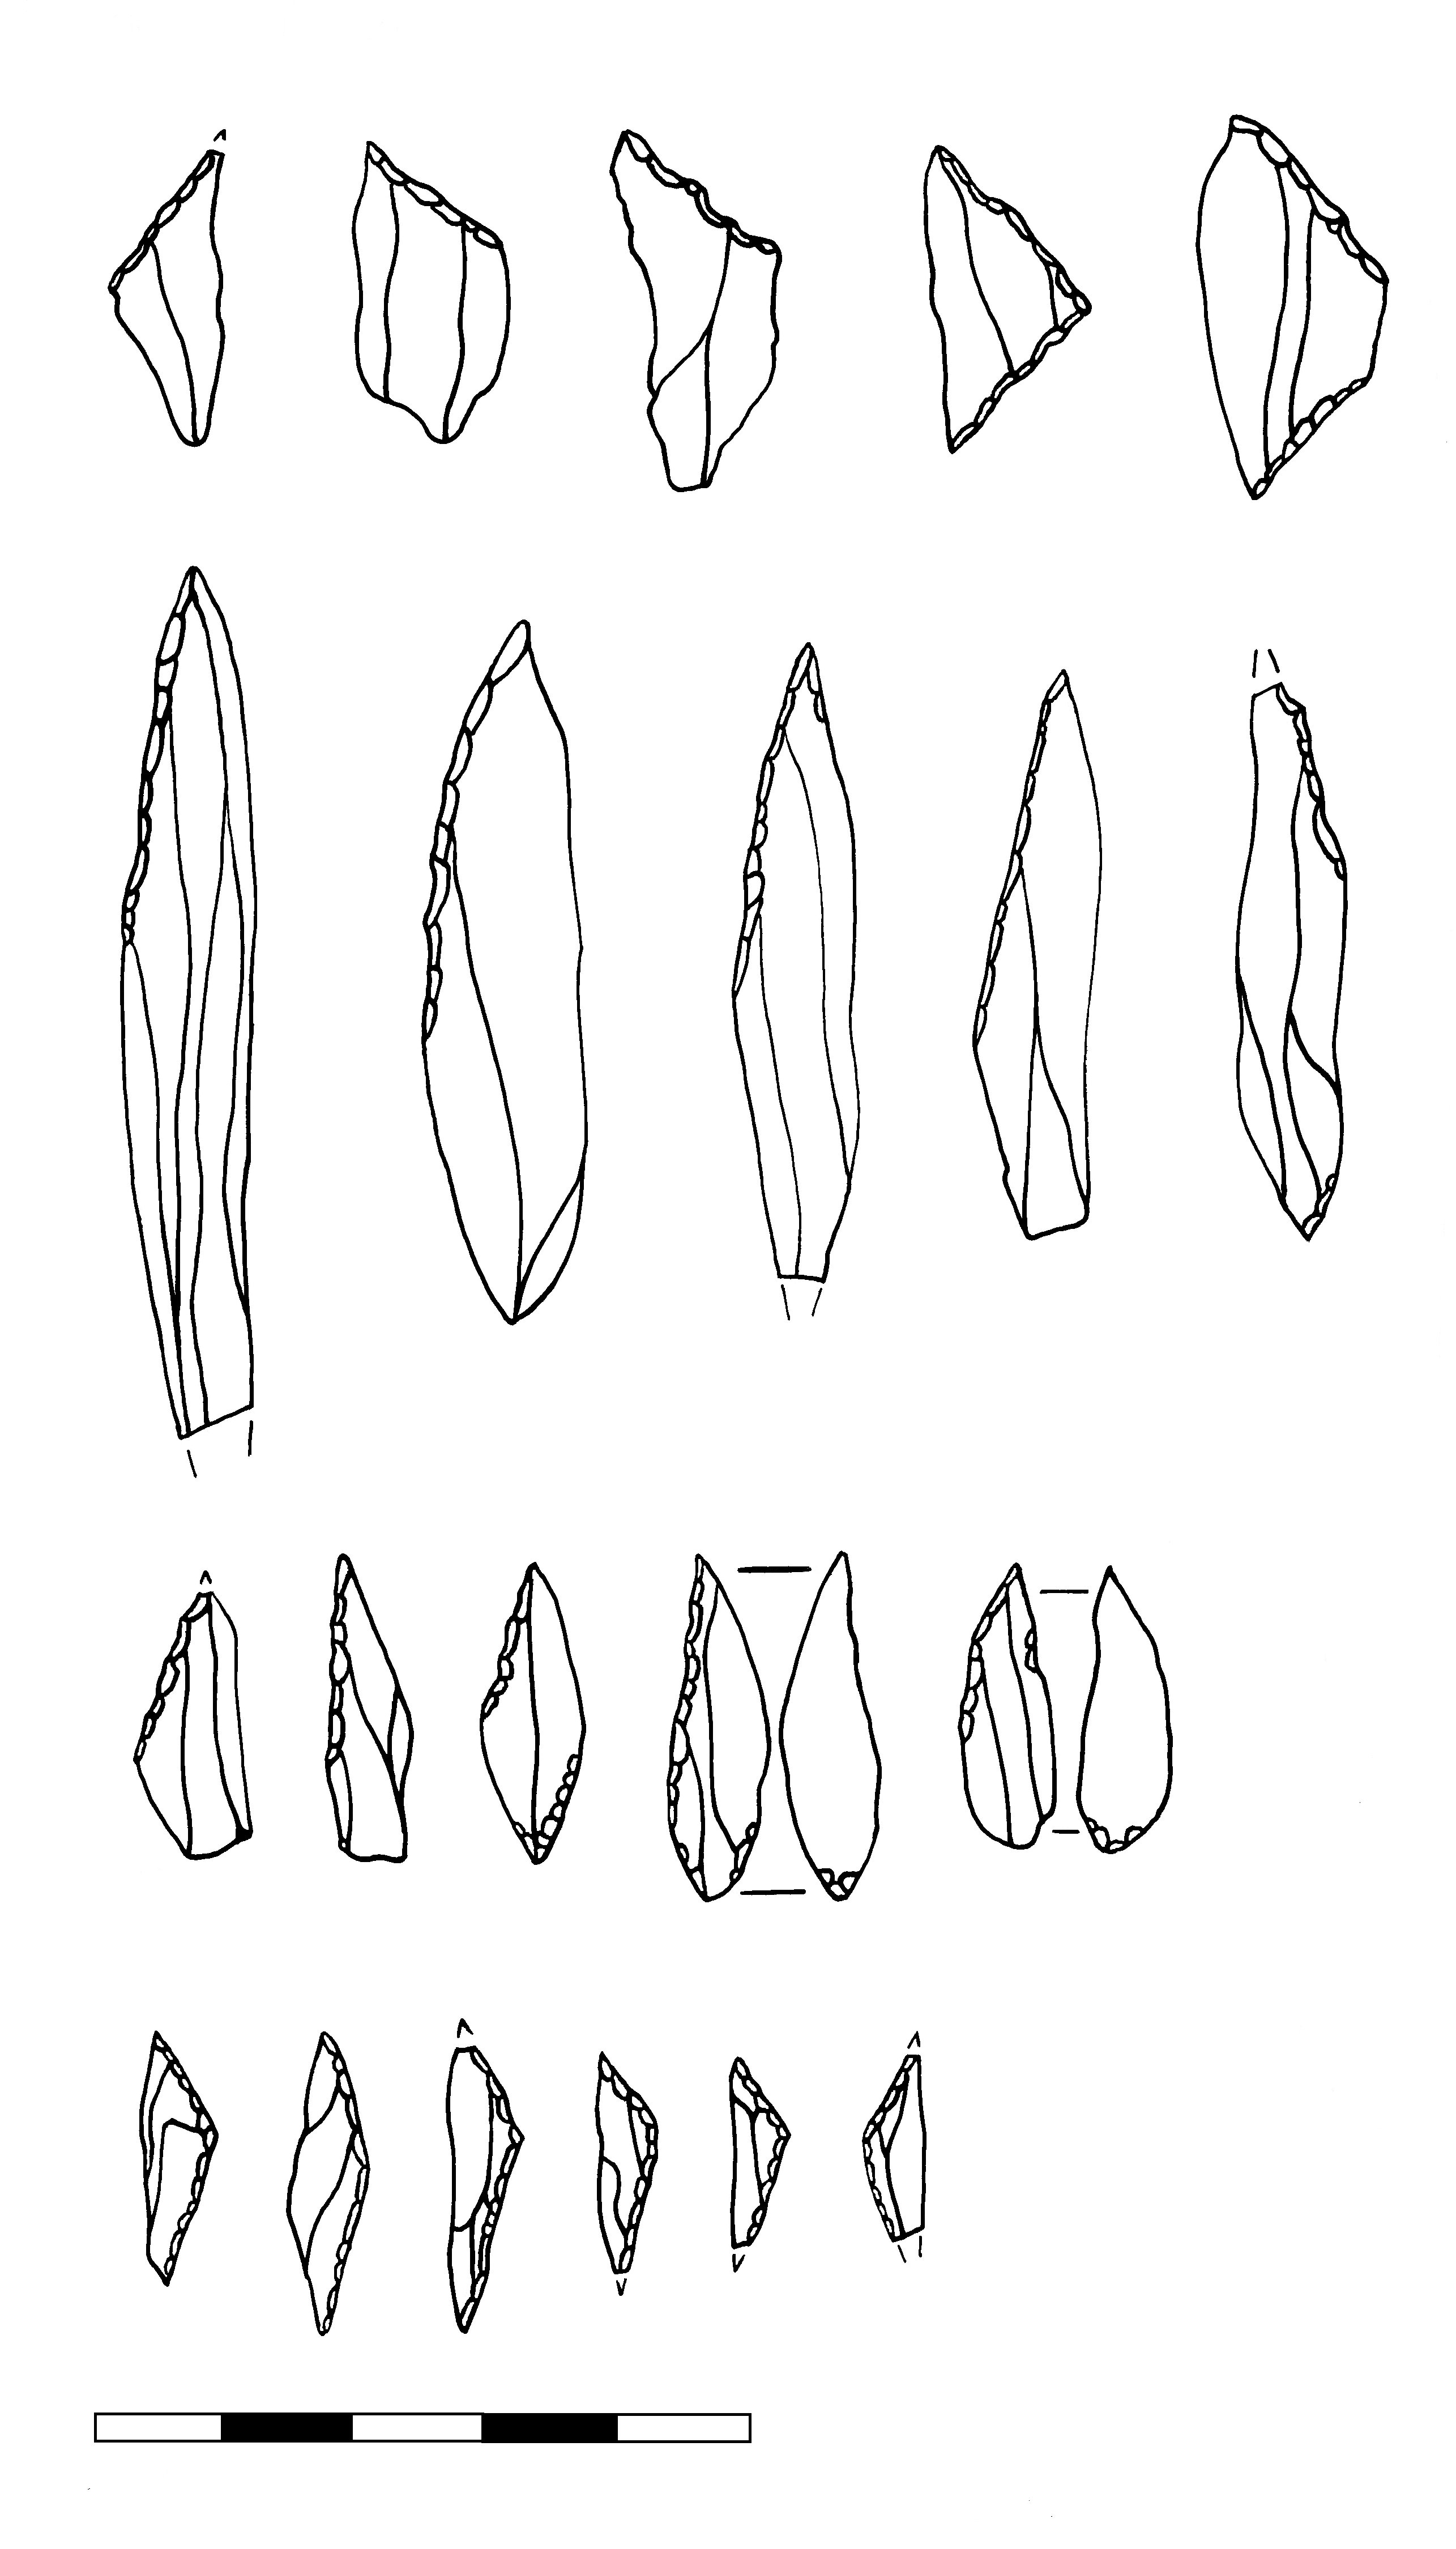
Figure 1: Microliths diagnostic of assemblage types. Row 1. Star Carr-type microliths from Star Carr, N. Yorks. Row 2. Deepcar type microliths from Lackford Heath, Suffolk. Row 3. A basally modified assemblage. A Honey Hill-type assemblage from Two Mile Bottom, Norfolk (redrawn from Jacobi 1984). Row 4. Small scalene triangles from Seamer K, N. Yorks (redrawn from David 1998)
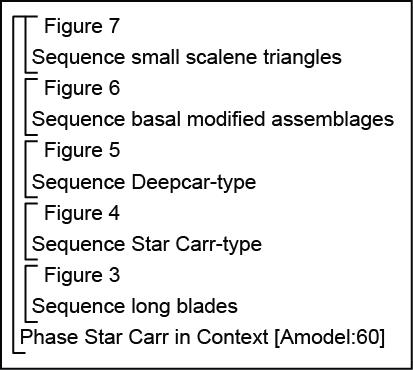
Figure 2: Overall form of the chronological models for the currency of different microlith types in Britain
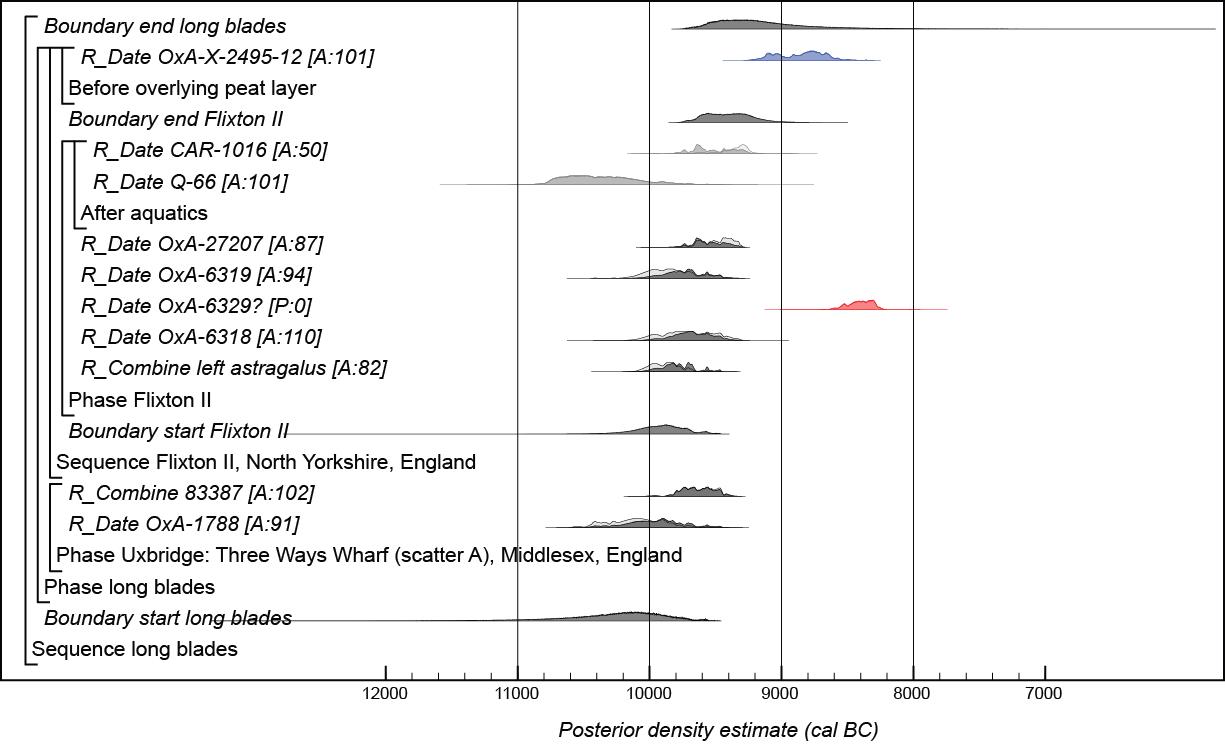
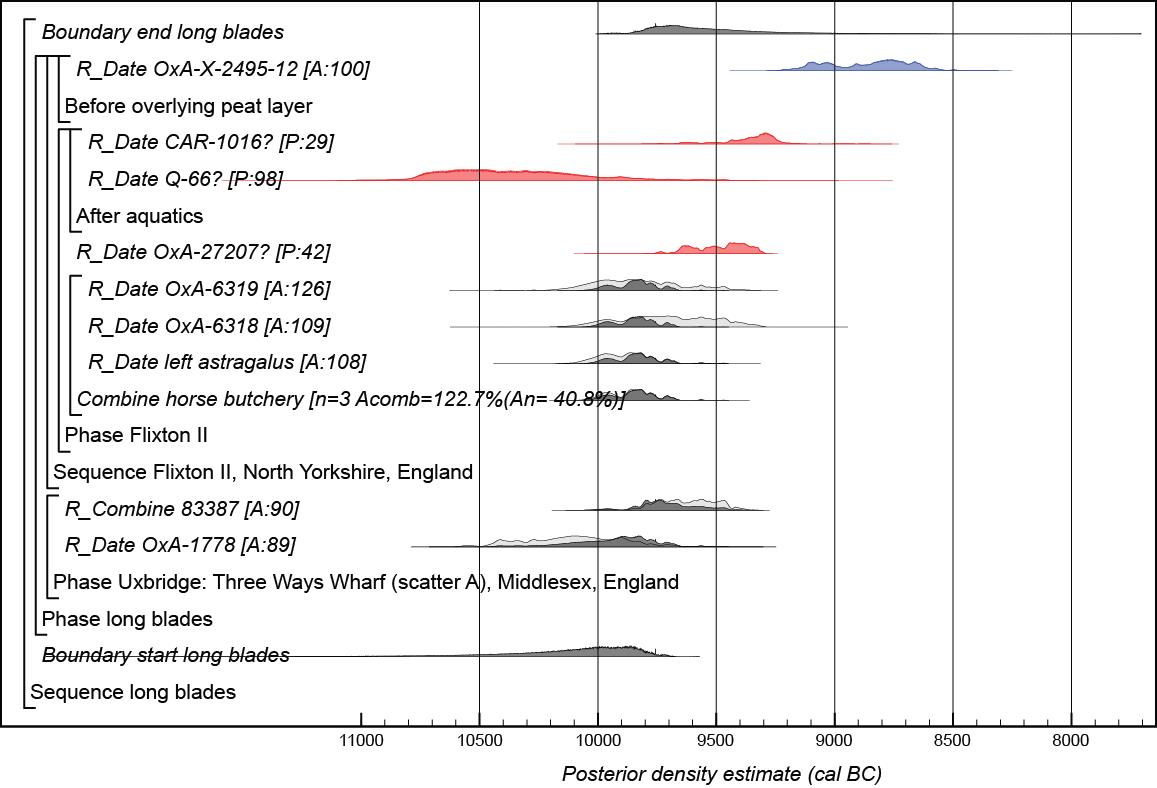
Figure 3: Probability distributions of radiocarbon dates associated with long blades. Each distribution represents the relative probability that an event occurs at a particular time. For each of the dates two distributions have been plotted: one in outline, which is the result of simple radiocarbon calibration, and a solid one, based on the chronological model used. Distributions other than those relating to particular samples correspond to aspects of the model. For example, the distribution 'start long blades' is the estimated date when long blades were first used in Britain. Measurements followed by a '?' have been excluded from the model for reasons described in the text. The large square brackets down the left-hand side along with the OxCal keywords define the overall model exactly. (red: excluded from model; grey: TPQ possible old-wood effect or hard-water error; blue: TPQ/TAQ stratigraphic constraint; red: excluded from model)
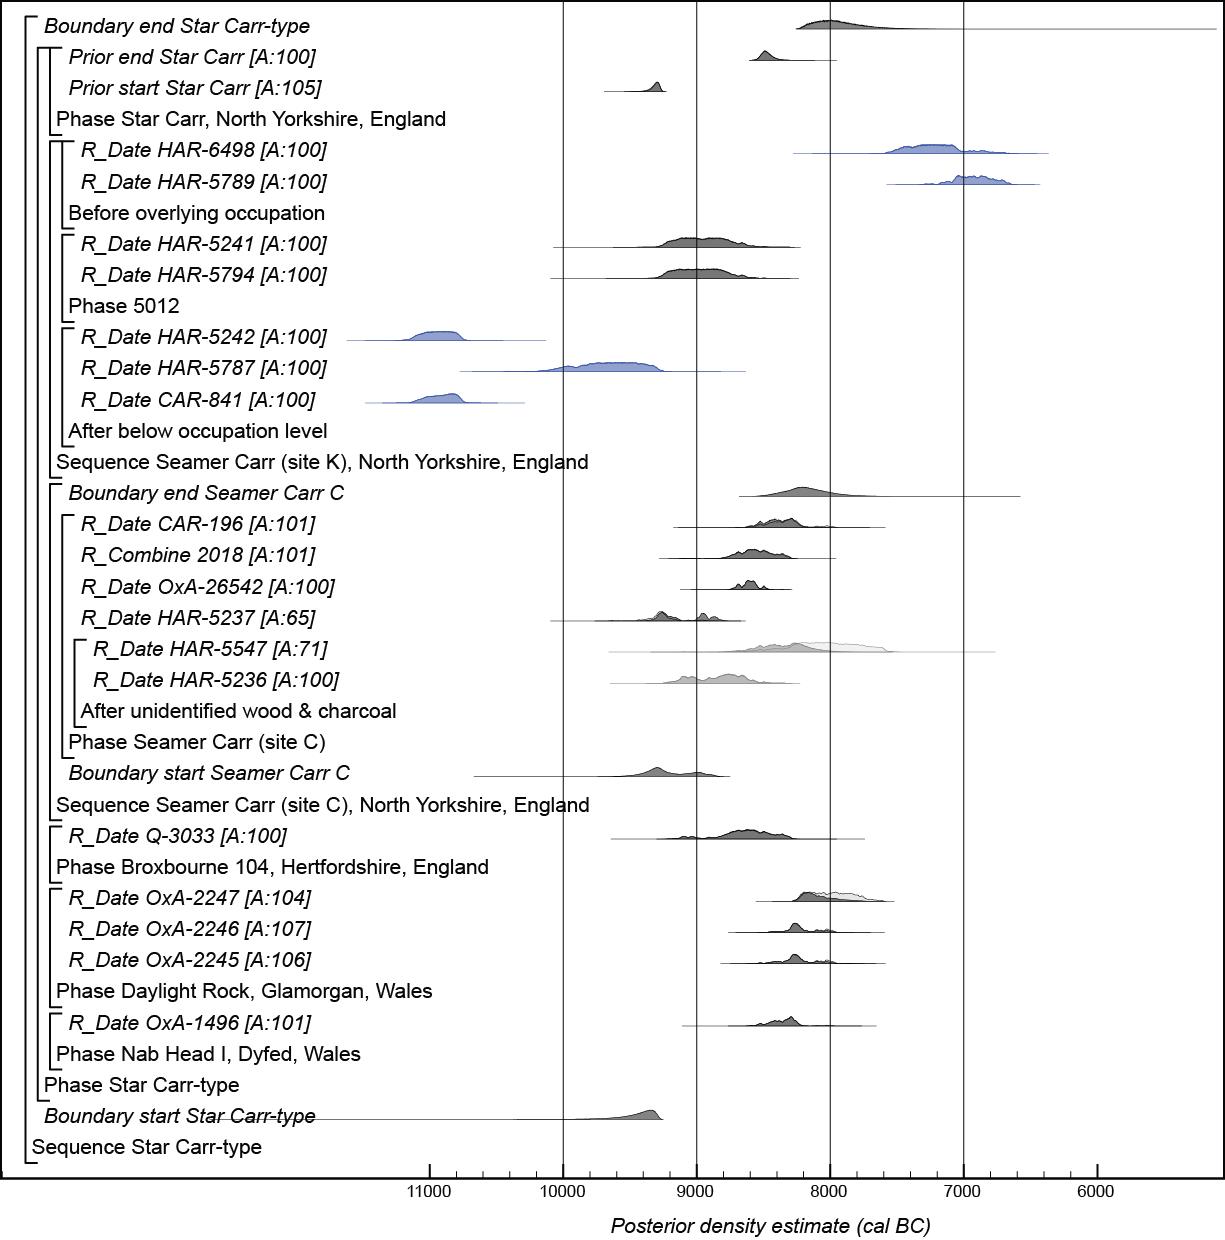
Figure 4: Probability distributions of radiocarbon dates associated with Star Carr-type microliths (the component relating to Star Carr is defined in Milner et al. in press, appendix 17.1, and key parameters only are shown). The format is identical to Figure 3
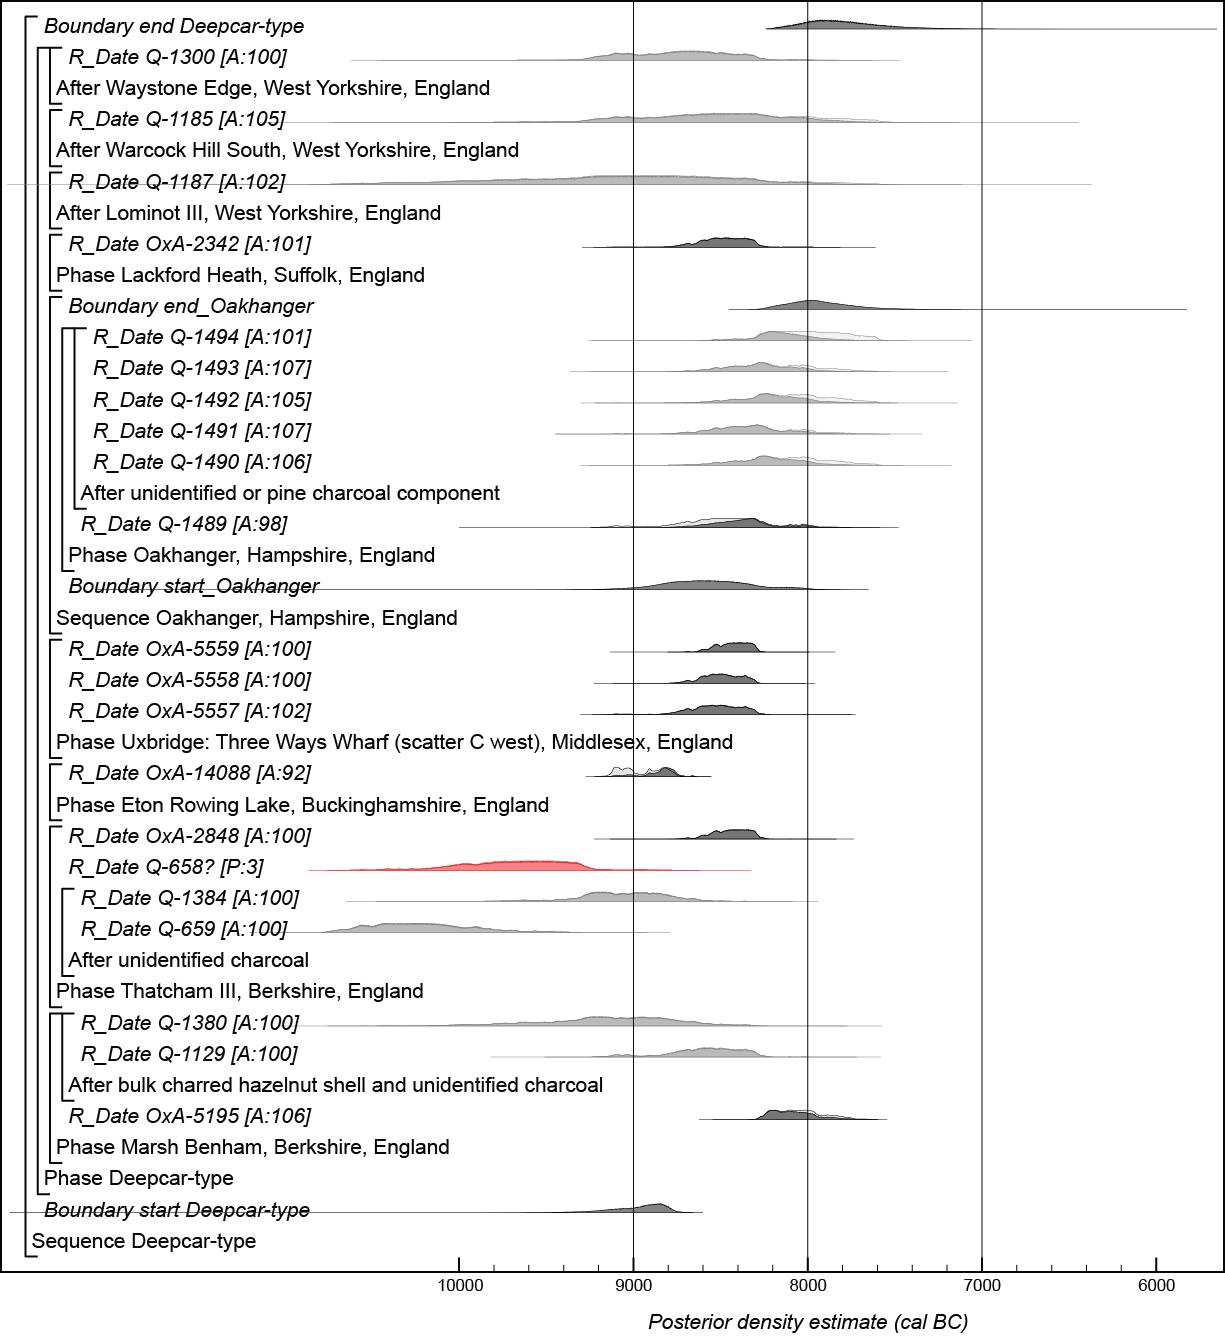
Figure 5: Probability distributions of radiocarbon dates associated with Deepcar-type microliths. The format is identical to Figure 3
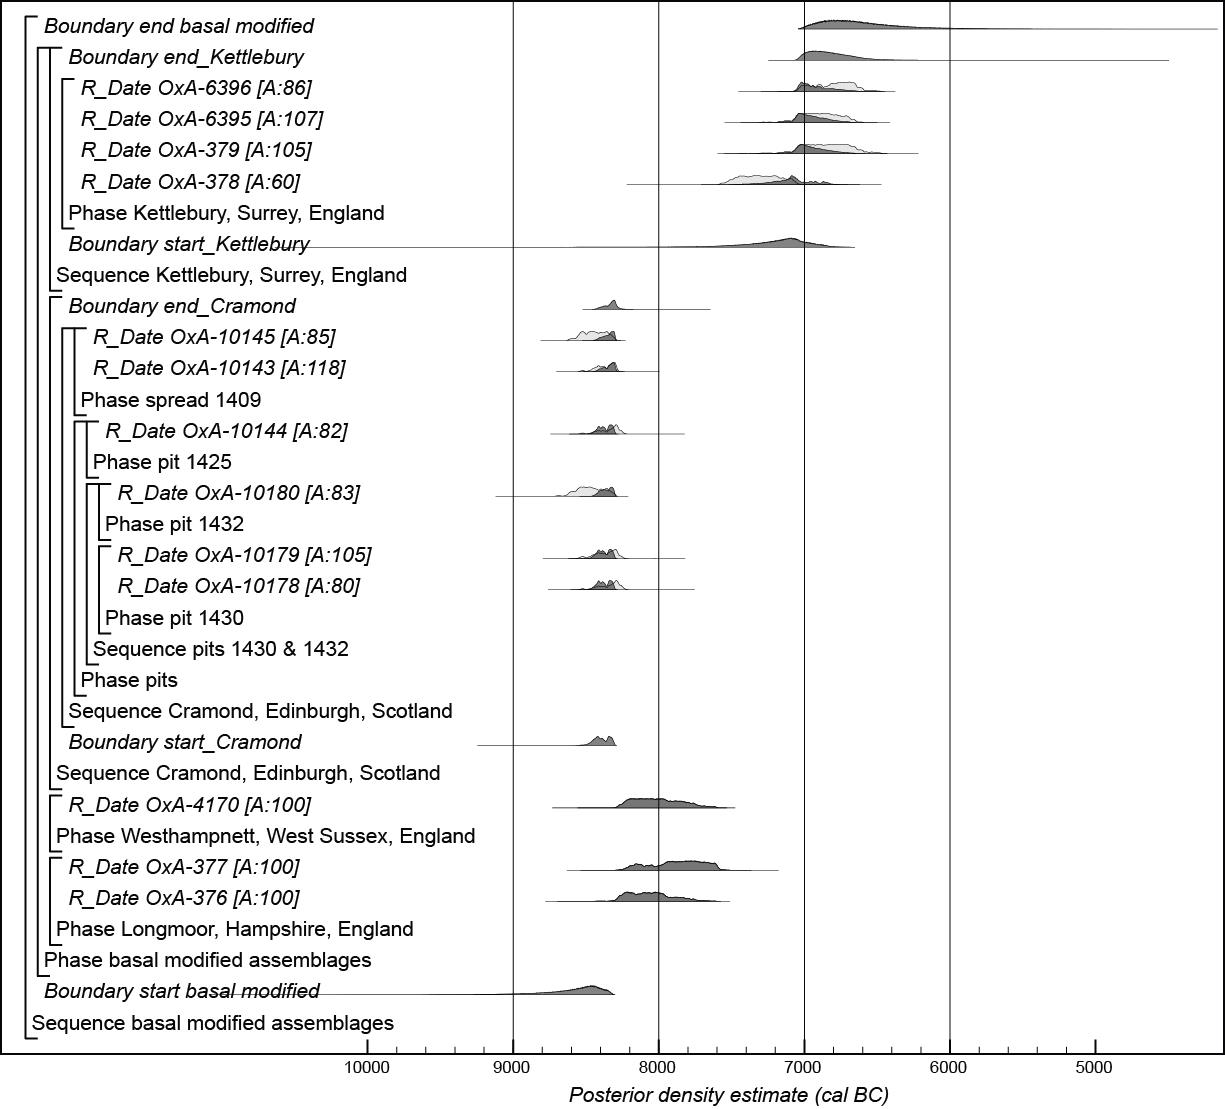
Figure 6: Probability distributions of radiocarbon dates associated with basally modified microliths. The format is identical to Figure 3
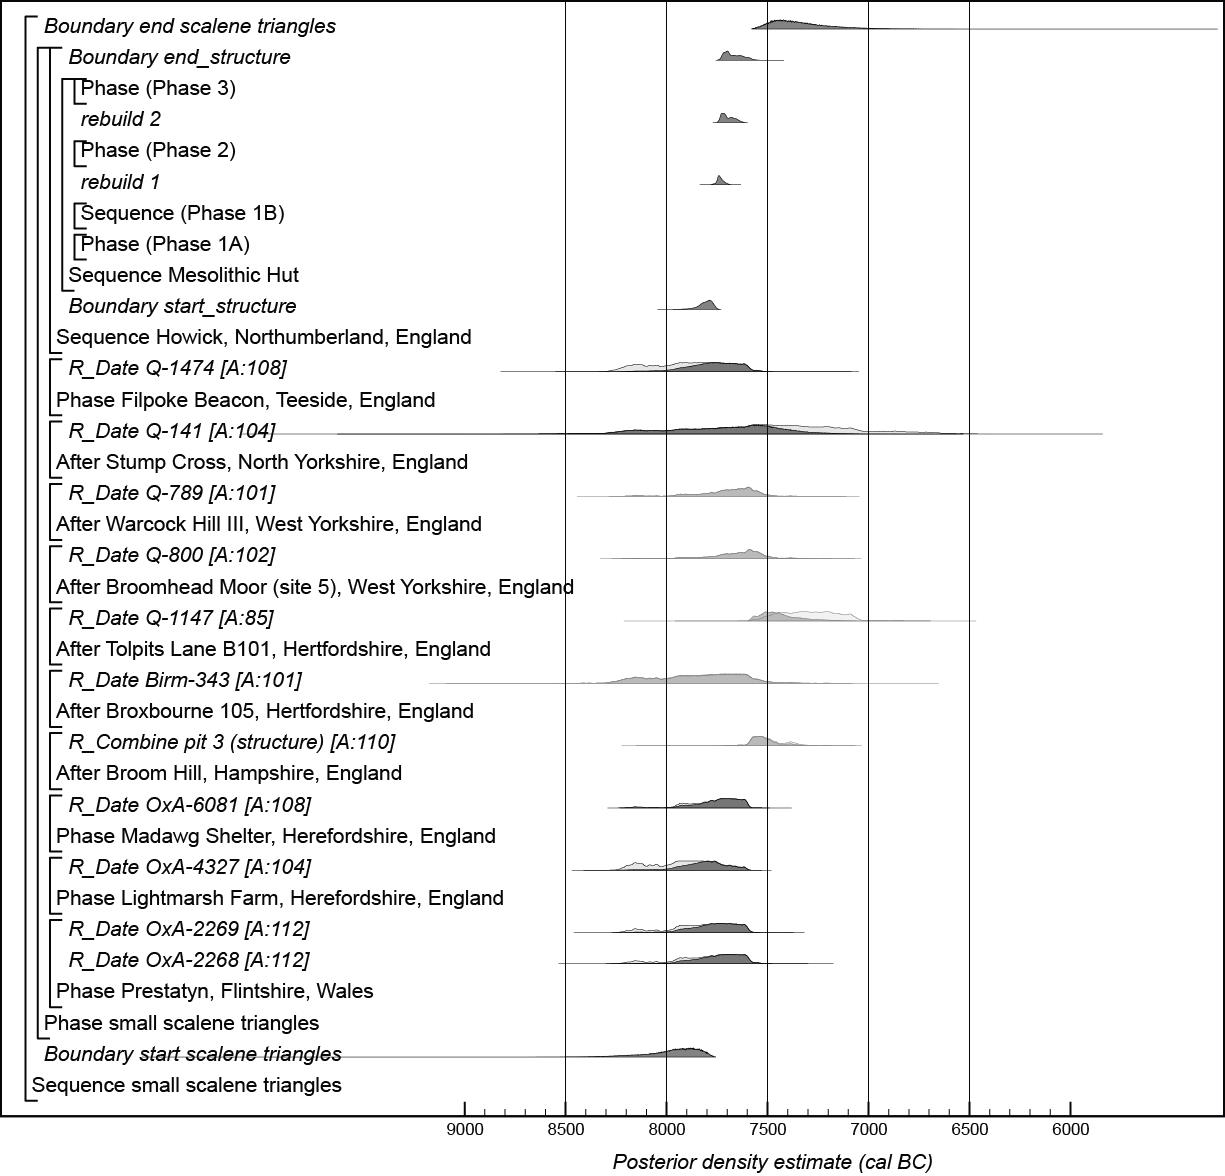
Figure 7: Probability distributions of radiocarbon dates associated with small scalene triangles (the component relating to Howick is defined by Bayliss et al. 2007b, fig. 6.2 and key parameters only are shown). The format is identical to Figure 3
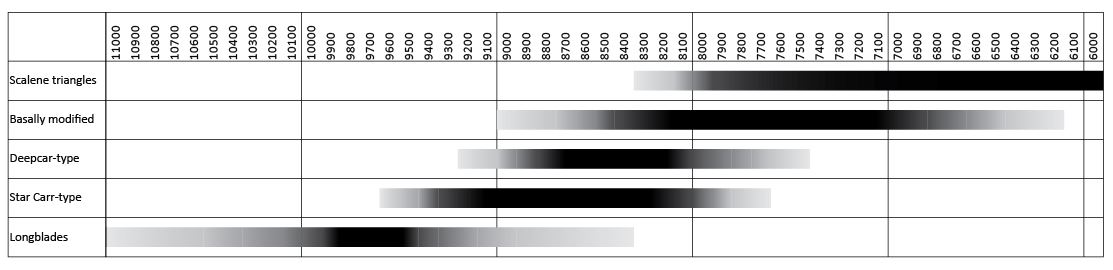
Figure 8: Summary of the currency of Early Mesolithic assemblage types. The shading reflects the probability that an assemblage type was in use at a particular time
Figure 9: Probability distributions of radiocarbon dates associated with long blade assemblages according to the alternative model described in the text. The format is identical to Figure 3
Internet Archaeology is an open access journal based in the Department of Archaeology, University of York. Except where otherwise noted, content from this work may be used under the terms of the Creative Commons Attribution 3.0 (CC BY) Unported licence, which permits unrestricted use, distribution, and reproduction in any medium, provided that attribution to the author(s), the title of the work, the Internet Archaeology journal and the relevant URL/DOI are given.
Terms and Conditions | Legal Statements | Privacy Policy | Cookies Policy | Citing Internet Archaeology
Internet Archaeology content is preserved for the long term with the Archaeology Data Service. Help sustain and support open access publication by donating to our Open Access Archaeology Fund.