Cite this as: Seaton, K-L., Laužikas, R., McKeague, P., Moitinho de Almeida, V., May, K. and Wright, H. 2023 Understanding Data Reuse and Barriers to Reuse of Archaeological Data. A quality-in-use methodological approach, Internet Archaeology 63. https://doi.org/10.11141/ia.63.8
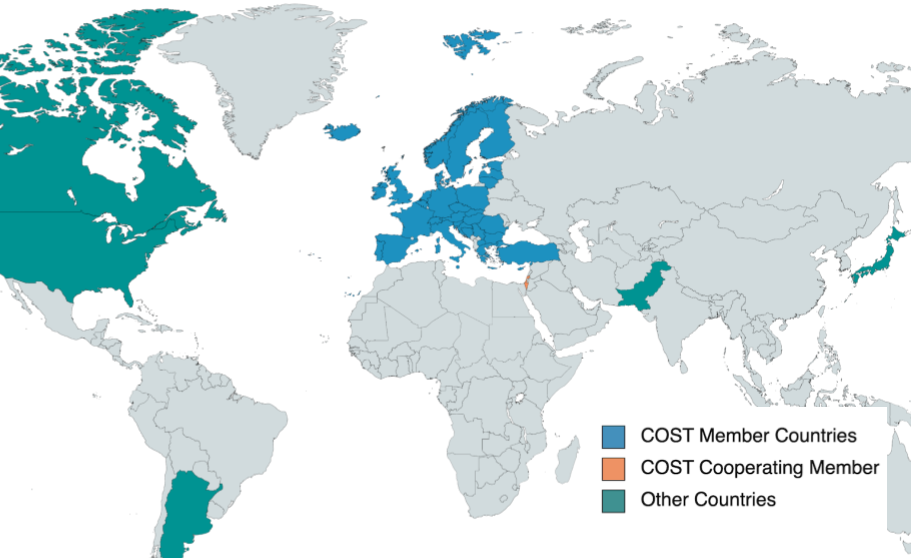
Over the past decade, innovation has helped address the interoperability of archaeological data, increasing the discoverability of data through integrated cross-searches and facilitating knowledge creation by combining data in new ways. An emerging research challenge for the next decade is understanding what constitutes good practice so that archaeological data can be optimised for reuse. Central to this research is understanding the current state-of-the-art, encompassing both existing best practices and barriers to using and reusing digital archaeological data. This topic is investigated within the framework of 'Saving European Archaeology from the Digital Dark Ages' (SEADDA), a European Cooperation in Science and Technology (COST) Action funded by the Horizon 2020 Framework Programme. Members of SEADDA represent 40 countries, 35 of which are COST members, and five are international partner countries (Fig. 1).
The SEADDA network comprises heritage specialists, archaeologists, academics, curators, and museum staff, who are all passionate about heritage data and have fostered a collaborative environment to progress this research. More specifically, the SEADDA research community is trying to understand the current state-of-the-art regarding the preservation, dissemination and reuse of archaeological data. Capacity building has been addressed through holding data management and stewardship workshops in member countries. A special edition of Internet Archaeology explored the work of Working Group 1, presenting the current state-of-the-art regarding preservation for 24 member countries (Richards et al. 2021). This article relates more specifically to the research undertaken by Working Group 4 (WG4) that examined the use and reuse of archaeological data.
The ambitions of WG4 were to understand the qualitative and quantitative barriers to data reuse, crucial to understanding the impact of the broad adoption of FAIR principles in the research landscape (Richards et al. 2021). An exploratory workshop was held online between 31 March and 2 April 2020 to help define the current landscape pertaining to digital data use and reuse, providing a springboard to tackle further research (Wright 2020). WG4 developed the approach described in this article following the workshop. After considering a broad survey profiling the reuse sector, a targeted survey exploring quantitative and qualitative reuse was developed, and three research questions were defined:
The decision was made to limit their investigation to explore the underlying infrastructure of search interfaces used by data archives and repositories. Qualitative data were collected to evaluate the user experience. A conscious decision was made not to evaluate a particular archaeological archive but to understand the processes of discovery, use and reuse of archaeological data. This article outlines the processes of developing a methodology to collect and evaluate data on the user experience and the subsequent results. The survey had limited success owing to methodological issues. Notwithstanding, the results provided several interesting points of discussion. The methodology WG4 designed posed limitations on the research design that should be considered in future iterations of research, along with narrowing the scope of tasks for participants.
The objective of WG4 was to understand who was using and reusing digital archaeological data and what challenges they experienced. There have been few studies that have explored the attitudes and opinions of a broad audience. An exception to this is Faniel et al. (2013, 297), who interviewed 22 archaeologists about their experiences reusing data. Several articles explore personal experiences reusing archaeological data (see Huggett 2018; Marwick and Pilaar Birch 2018; Kansa et al. 2014 and Sobotkova 2018 for examples). Geser et al. (2022) collected quantitative data on the policies and practices of digital archives, aimed more at an institutional level. The challenge for WG4 then was determining how qualitative data should be collected. The research members approached this challenge by adopting the 'Quality-in-Use' conceptual approach. Quality-in-use is 'the degree to which a product or system can be used by specific users to meet their needs to achieve specific goals with effectiveness, efficiency, satisfaction, and freedom from risk in specific contexts of use' (International Organisation for Standardisation 2016, 41). The research methodology utilised two existing standards to create a method and a uniform set of metrics.
The research methodology developed was based on existing approaches. A user-based approach to measuring product quality recognises that the values placed on product characteristics will vary between users (Garvin 1984, 27). In response to this approach, two existing ISO standards were adopted. The SQuaRE (System and Software Quality Requirements and Evaluation) model, represented in the ISO/IEC 25000 standards series, is a tool for evaluating software quality (International Organisation for Standardisation 2017), while ISO/IEC 25022:2016 provides a set of standardised measurement functions that measure software performance from the user's perspective (International Organisation for Standardisation 2016). The methodological model created consisted of five characteristics (effectiveness, efficiency, satisfaction, context coverage and usability) with 14 measures (task completeness, objectives achieved, task time, cost-effectiveness, overall satisfaction, satisfaction with features, user trust in the system, the data and metadata, user pleasure, physical comfort, context completeness, flexible context of use and user guidance completeness). In addition, the study was bound by (i) the reuse of digital archaeological archives; (ii) orientation to content usability and reusability; (iii) maintaining a user-orientated approach; (iv) collecting data from professionals in archaeology and heritage. Testing the methodology required a context that described the specific user, environment and goals for reusing data. Three user types were nominated to maintain comparable results, and user scenarios were developed that reflected real-life examples for reusing data. The scenarios were developed from existing research questions that research group members had.
Three GIS user scenarios were developed that tested the different needs of GIS users. The first scenario tested the users' ability to locate data by means of the functionality of archive catalogues to find and access GIS data, not whether a particular dataset has been archived or interoperability across data discovered. The second scenario tested functionality and the ability to download datasets within web map browsers. The third scenario was more specialised and explored the awareness and use of web services to access information. While the scenarios tested archive discovery and accessibility, they did not explore issues of interoperability or formats across the datasets discovered.
Two scenarios were designed to examine 3D Pottery data. Both scenarios required the user to locate high-resolution 3D models of pottery. These two scenarios were similar to the GIS scenarios and examined the users' ability to locate data and their awareness of web-based visualisation services. The limitation of the scenarios was a general lack of openly available 3D Pottery data.
As with the other two research areas, the single radiocarbon scenario tested the ability of users to locate data. While the scenario developed was specific to an existing research question, the research question was somewhat niche, and there was an awareness that this may impact the overall result.
Each scenario was broken down into objectives and tasks to achieve those objectives. These tasks provided a series of templates that could be used to test the methodology. The number of tasks varied between four to five for each scenario. A workflow and online survey form, designed to emulate the ISO25022 metrics, was developed using Qualtrics software to test the Quality-in-Use methodology. The research group decided that a survey provided the best opportunity for testing the methodology as it could be sent to other members of SEADDA to increase the testing rate. A series of discussions occurred discussing the survey format and the best way to test the Quality-in-Use methodology. Survey development was iterative, allowing all members to contribute to the final product. The scenarios required some redevelopment to ensure consistency. When changes to one scenario were suggested, the other scenarios also needed to be changed to ensure consistency.
The Quality-in-Use survey was divided into three sections:
The data collected in the second section were primarily quantitative, with space for respondents to add comments (see Appendix A [PDF] for a full list of survey questions). The questions in the third section related to the 14 measures in ISO/IEC 25022:2016. These were qualitative questions centred on user satisfaction, context and usability concerning the tasks completed in the second section of the survey. There was concern that respondents may abandon the survey if they had too many text boxes to fill out. Therefore, questions relating to user satisfaction and trust were set out in a matrix, with free-text boxes to provide further comments. The matrix used a Likert scale, as suggested by the ISO standard. However, cultural implications exist regarding the Likert scale, ranging from how scores are assigned to a general sense of discomfort with this type of measurement (Lee et al. 2002, 296). Nevertheless, Likert scales are common for surveys and easily recognisable by respondents, so alternative scoring methods were not explored.
The survey was distributed through SEADDA channels, and personal invitations to participate were sent by WG4 members to colleagues or promoted during presentations. The survey was open from 30 March 2022 to 30 April 2022. Preliminary survey results were presented to a joint Working Group 1 (WG1) and the WG4 SEADDA workshop in Braga, Portugal, in May 2022. Discussion of the results at the workshop helped identify bias within the results to improve the methodology and identify other issues, such as confusion with terminology or challenges in completing the survey. In total, 73 received responses were completed to 100%, and only the completed responses were used for this analysis.
Survey respondents were asked to nominate a digital repository for testing. The total number of repositories tested was 41, with 30 being tested only once (Table 1). Initially, WG4 had discussed the possibility of limiting the number of platforms tested. Restricting testing to a small selection of repositories had the advantage of comparing their strengths and weaknesses. However, this also had the potential to single out specific repositories where the results highlighted weaknesses, thus causing reputational damage. Instead, the scope of the tasks was limited to ensure a consistent evaluation across multiple platforms. With hindsight, scores within the same repository could have verified the results. On the other hand, the survey has created a list of repositories with archaeological data, several of which are in languages other than English, which is a helpful resource. Future iterations of the methodology could focus on a finite list of repositories to capture data not recorded with the first survey.
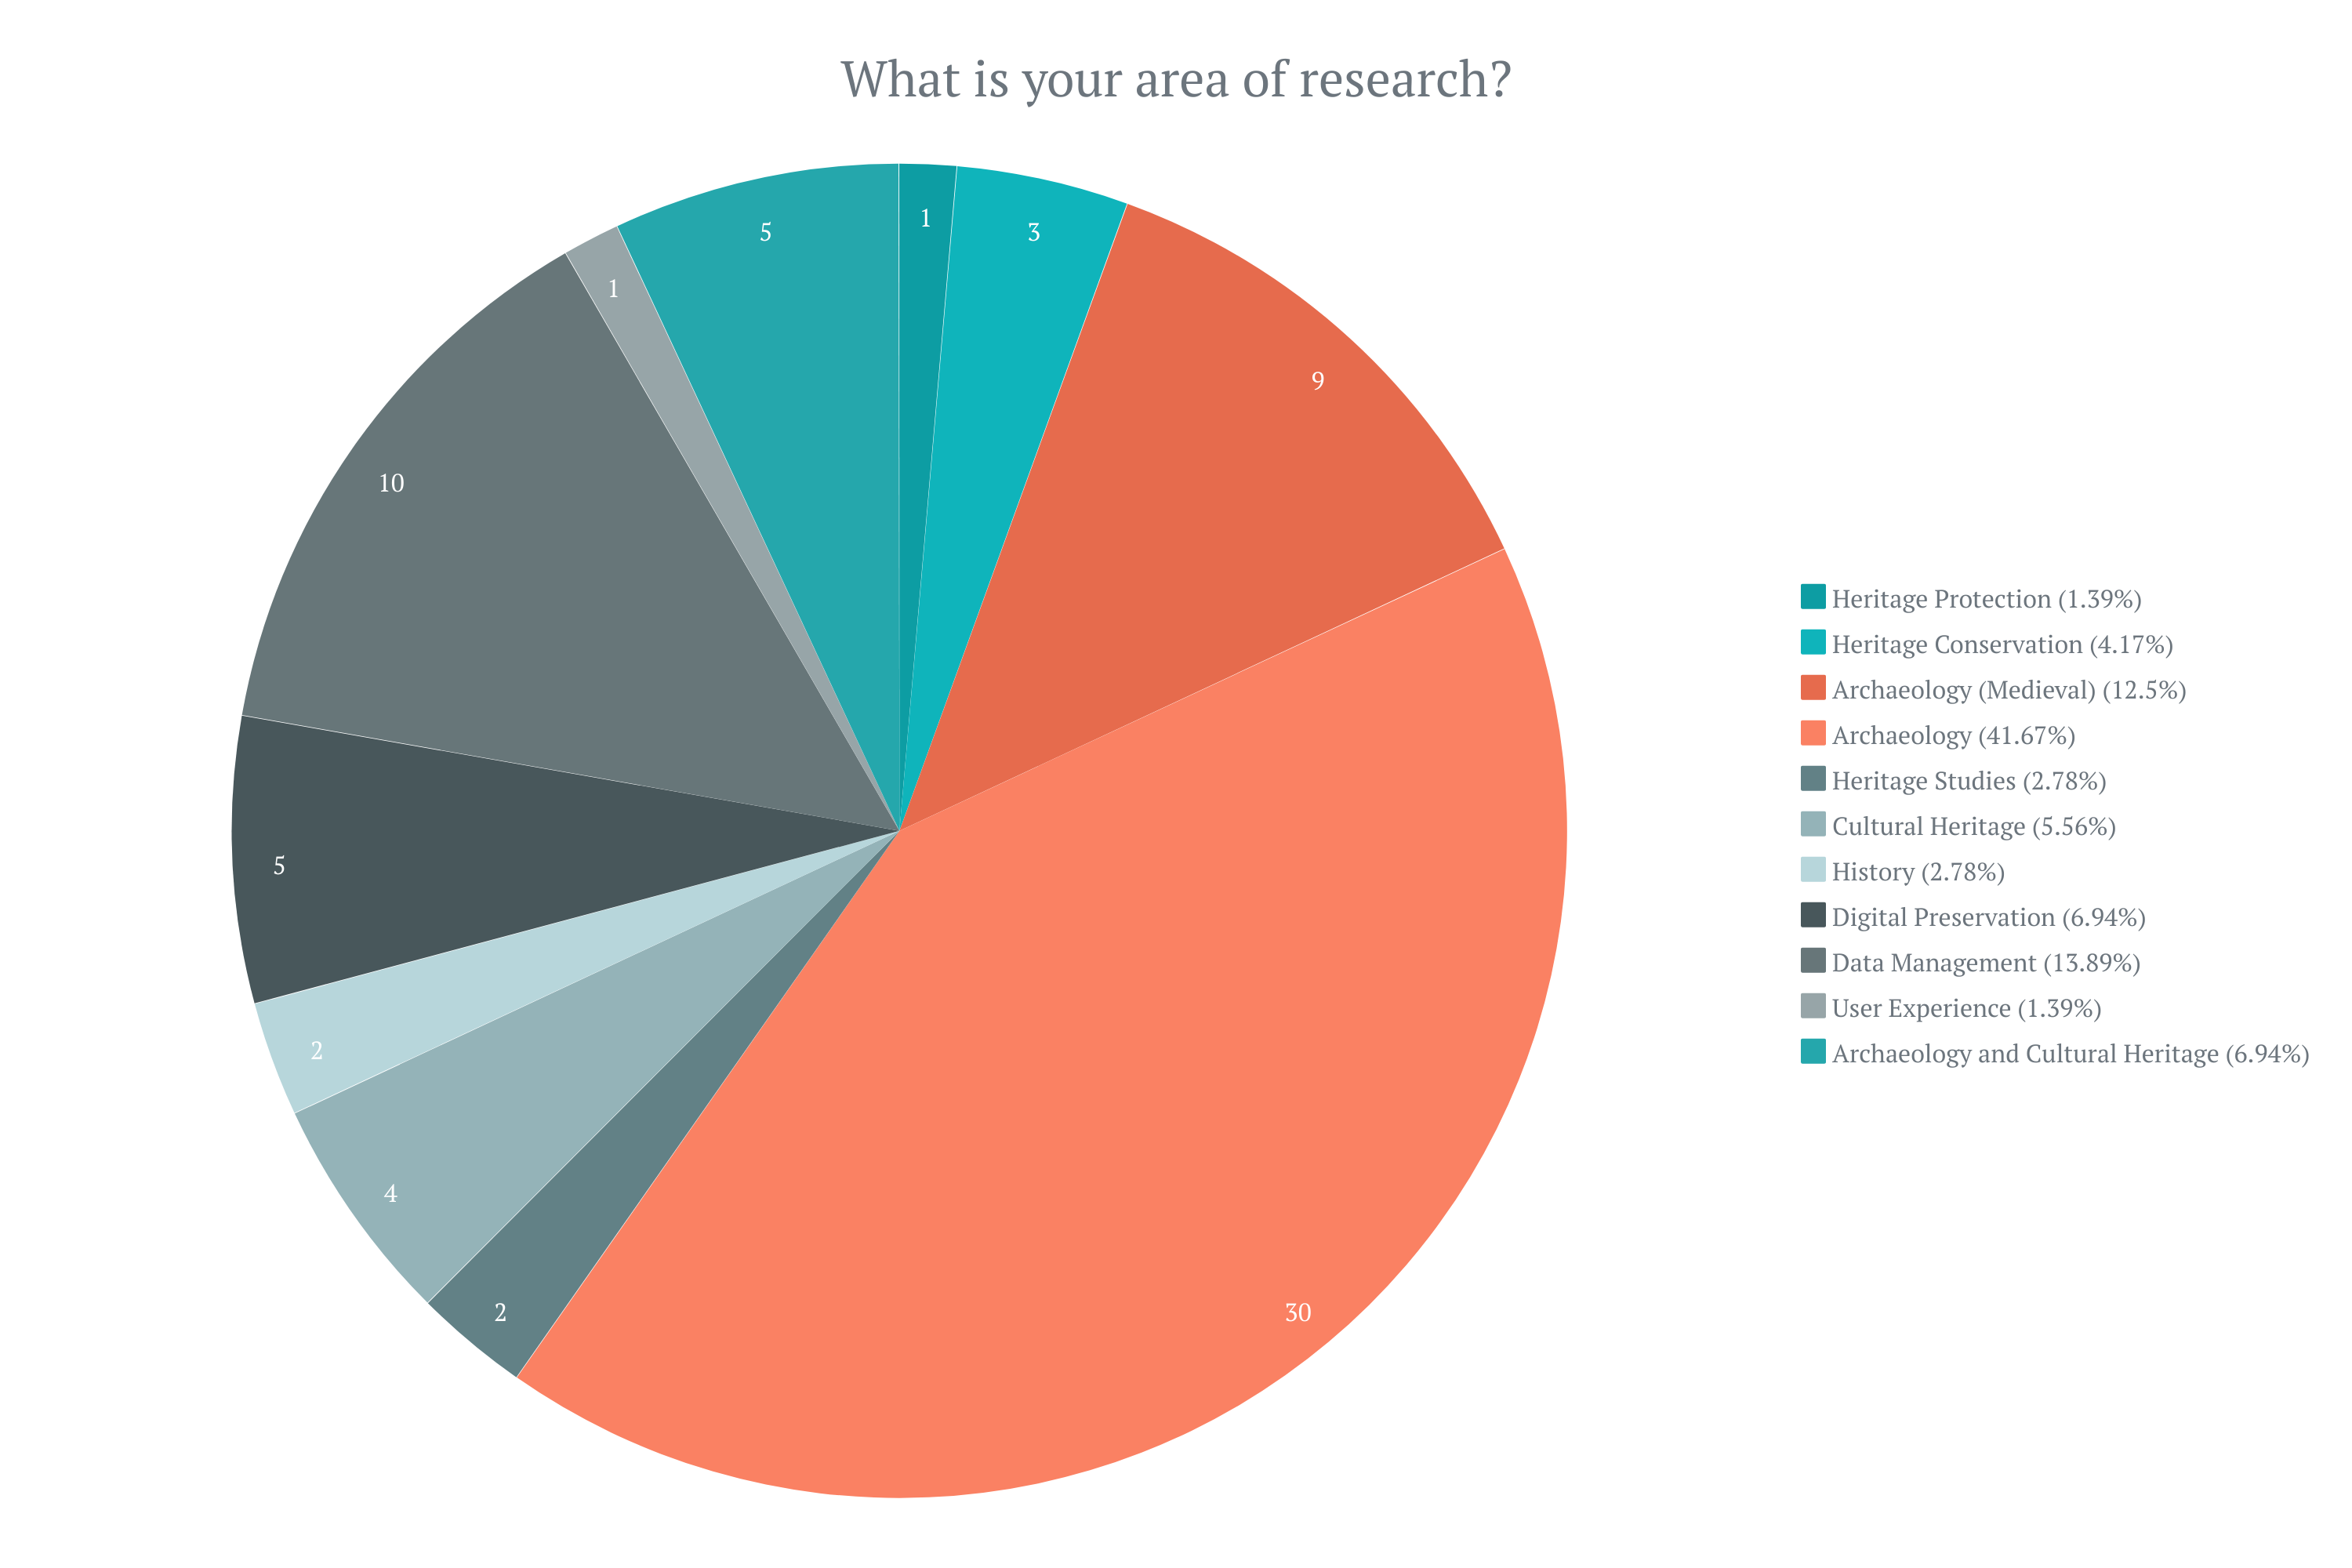
Demographic data were collected to determine whether the user experience varied between user locations or job roles. Primarily, the research area of respondents was in archaeology or data management (Fig. 2).
Responses were received from 21 countries, with a significant response from the United Kingdom (UK) (Table 2). This result may be biased as staff from the Archaeology Data Service (ADS) were asked to complete the survey. Multiple responses from individual respondents further skewed analysis of the survey results. However, making comparative interpretations based on geographic location is problematic owing to the sample size. Therefore regional variations were not considered for this analysis.
| Country | Respondents |
|---|---|
| Germany | 1 |
| Greece | 5 |
| Hungary | 3 |
| Ireland | 3 |
| Lithuania | 4 |
| Norway | 2 |
| Poland | 4 |
| Portugal | 4 |
| Serbia | 2 |
| Spain | 2 |
| Sweden | 1 |
| Switzerland | 1 |
| Turkey | 1 |
| United Kingdom of Great Britain and Northern Ireland | 21 |
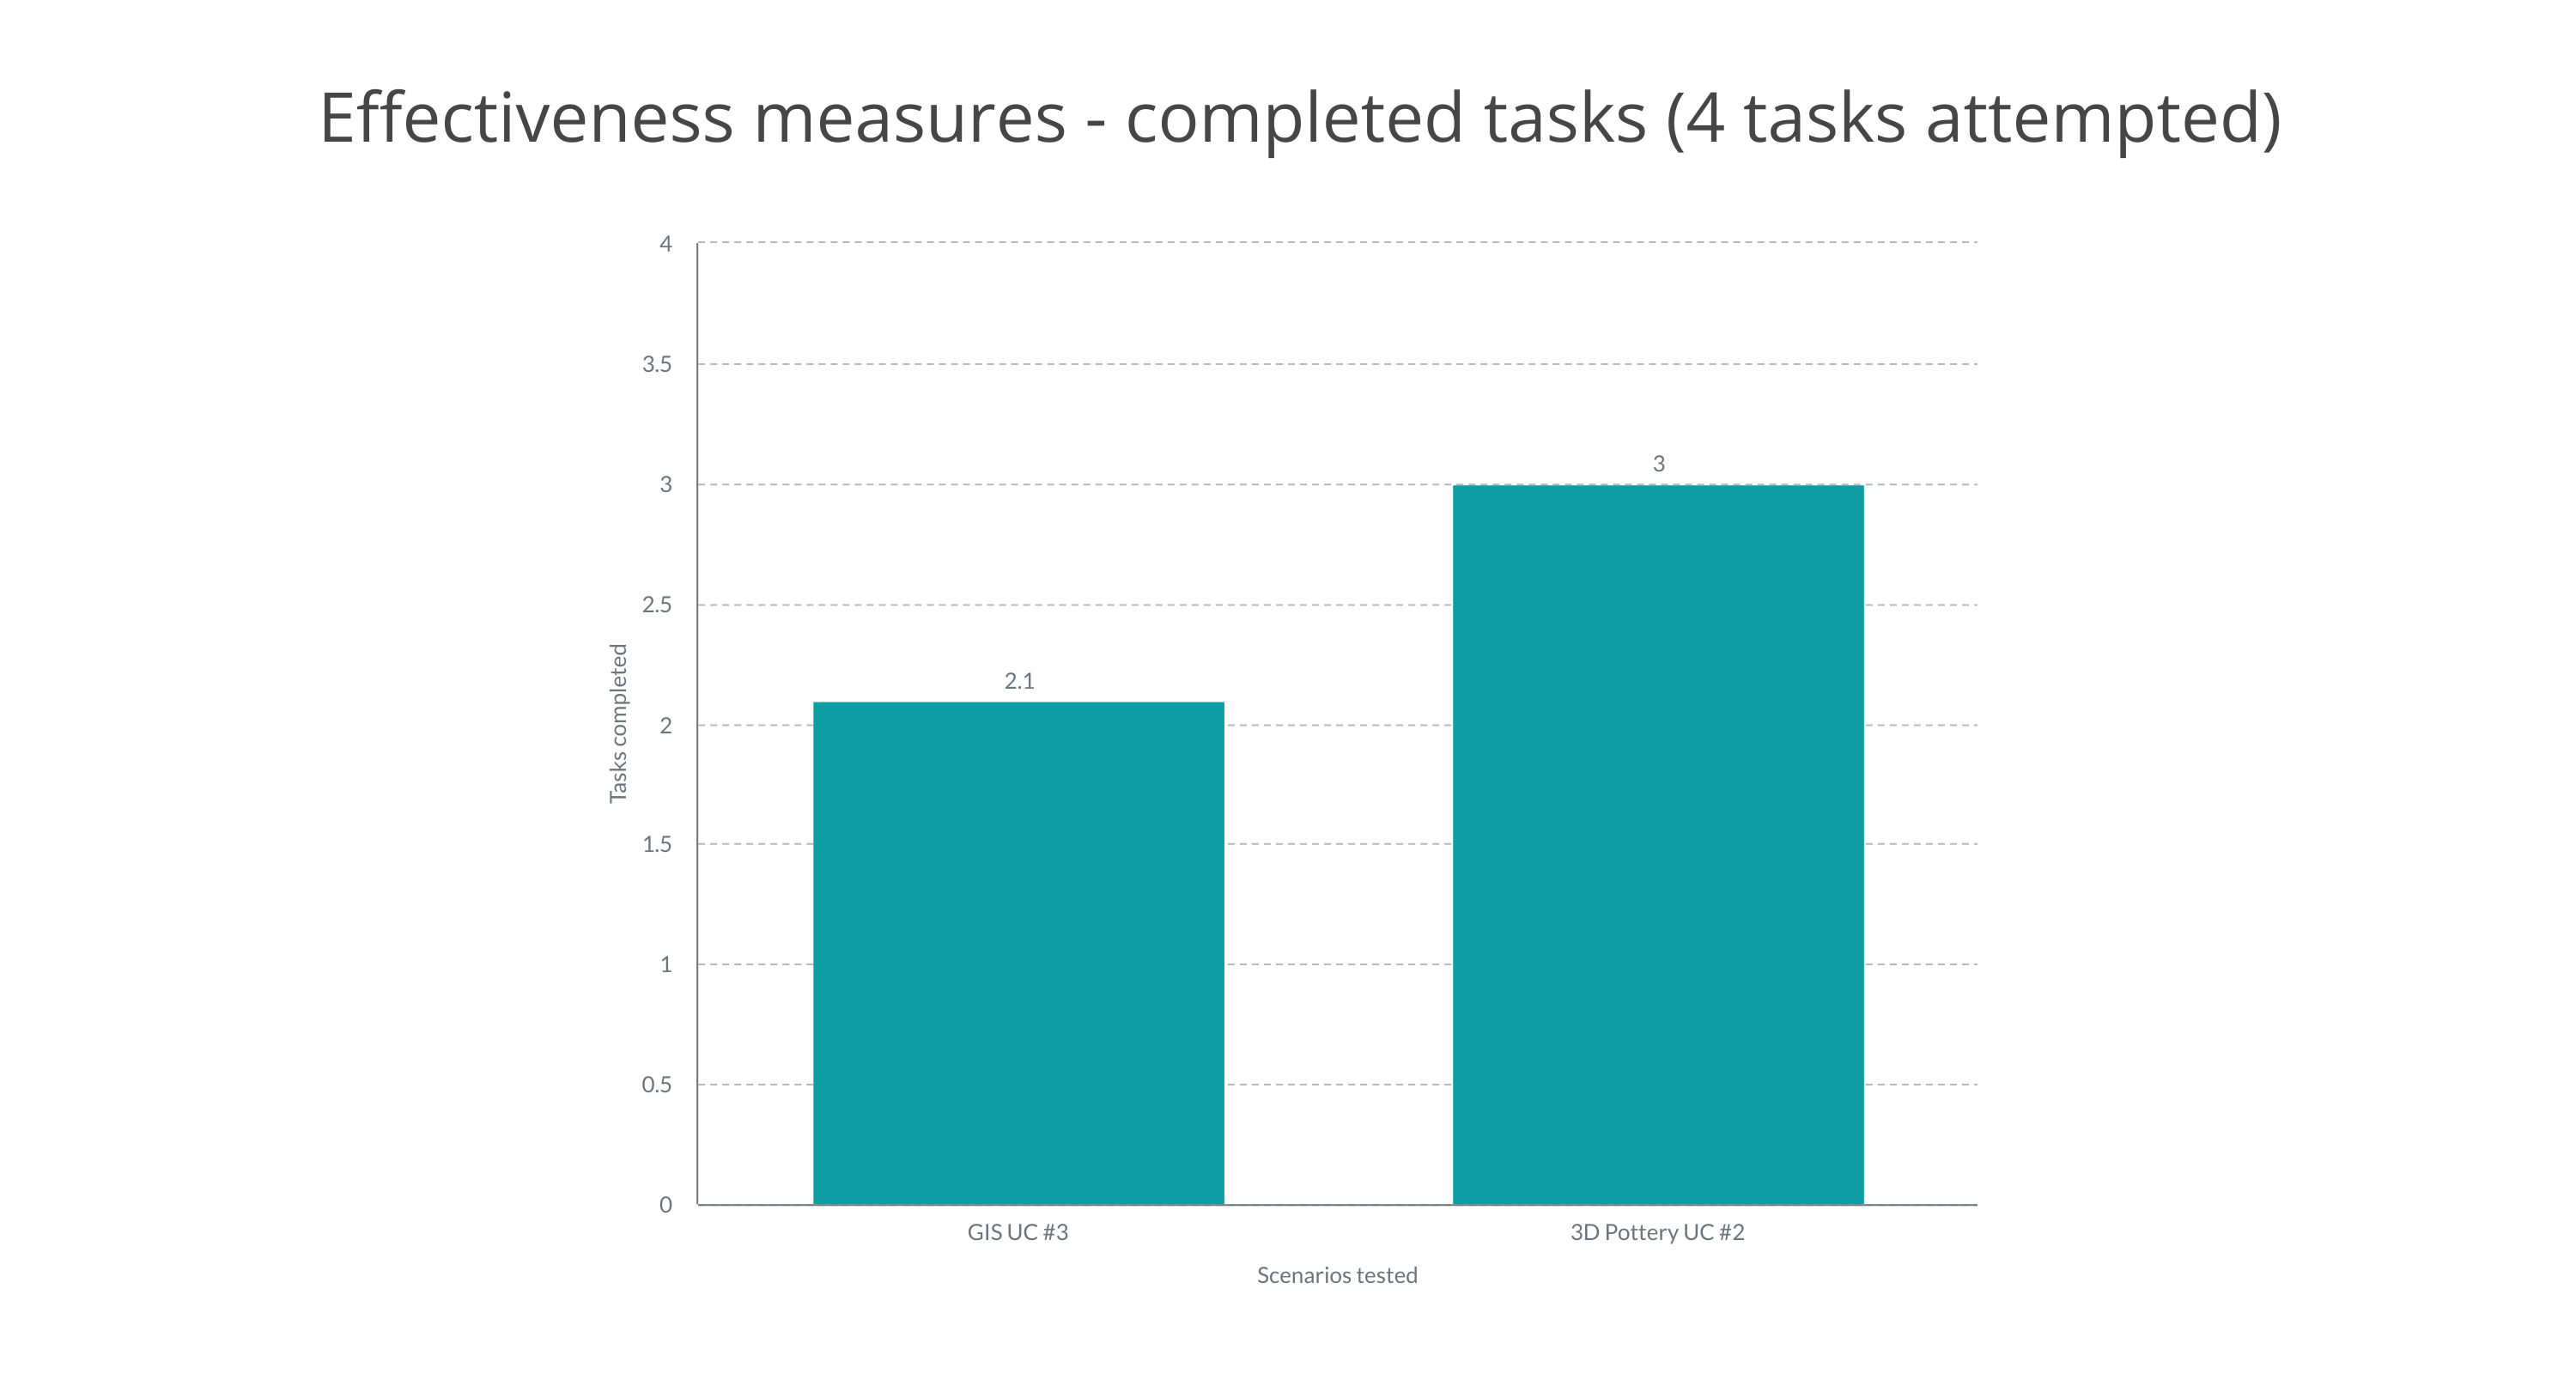
Two indicators of user performance are effectiveness and efficiency. Effectiveness evaluates whether the respondent could complete the tasks on their chosen platform (refer to The British Standards Institution 2016, 11, for further detail). This quantitative measurement is not concerned with how a goal might be performed. The interpretation of these measures is subjective based on the context to which it is applied (The British Standards Institution 2016, 35). Effectiveness is measured by the number of tasks completed and the number of objectives achieved. Task completion is measured as the total number of tasks the user was asked to do and compared to the number of tasks the user could complete. Objectives achieved examine the tasks' complexity and are measured through the weighted values allocated to each task. In this survey, weighting was used to assess the importance of the task rather than its complexity. Unlike measuring the tasks, objectives achieved take partially completed tasks into consideration.
The results indicate that for each scenario, at least half of the tasks could be completed (Figs 3 and 4).
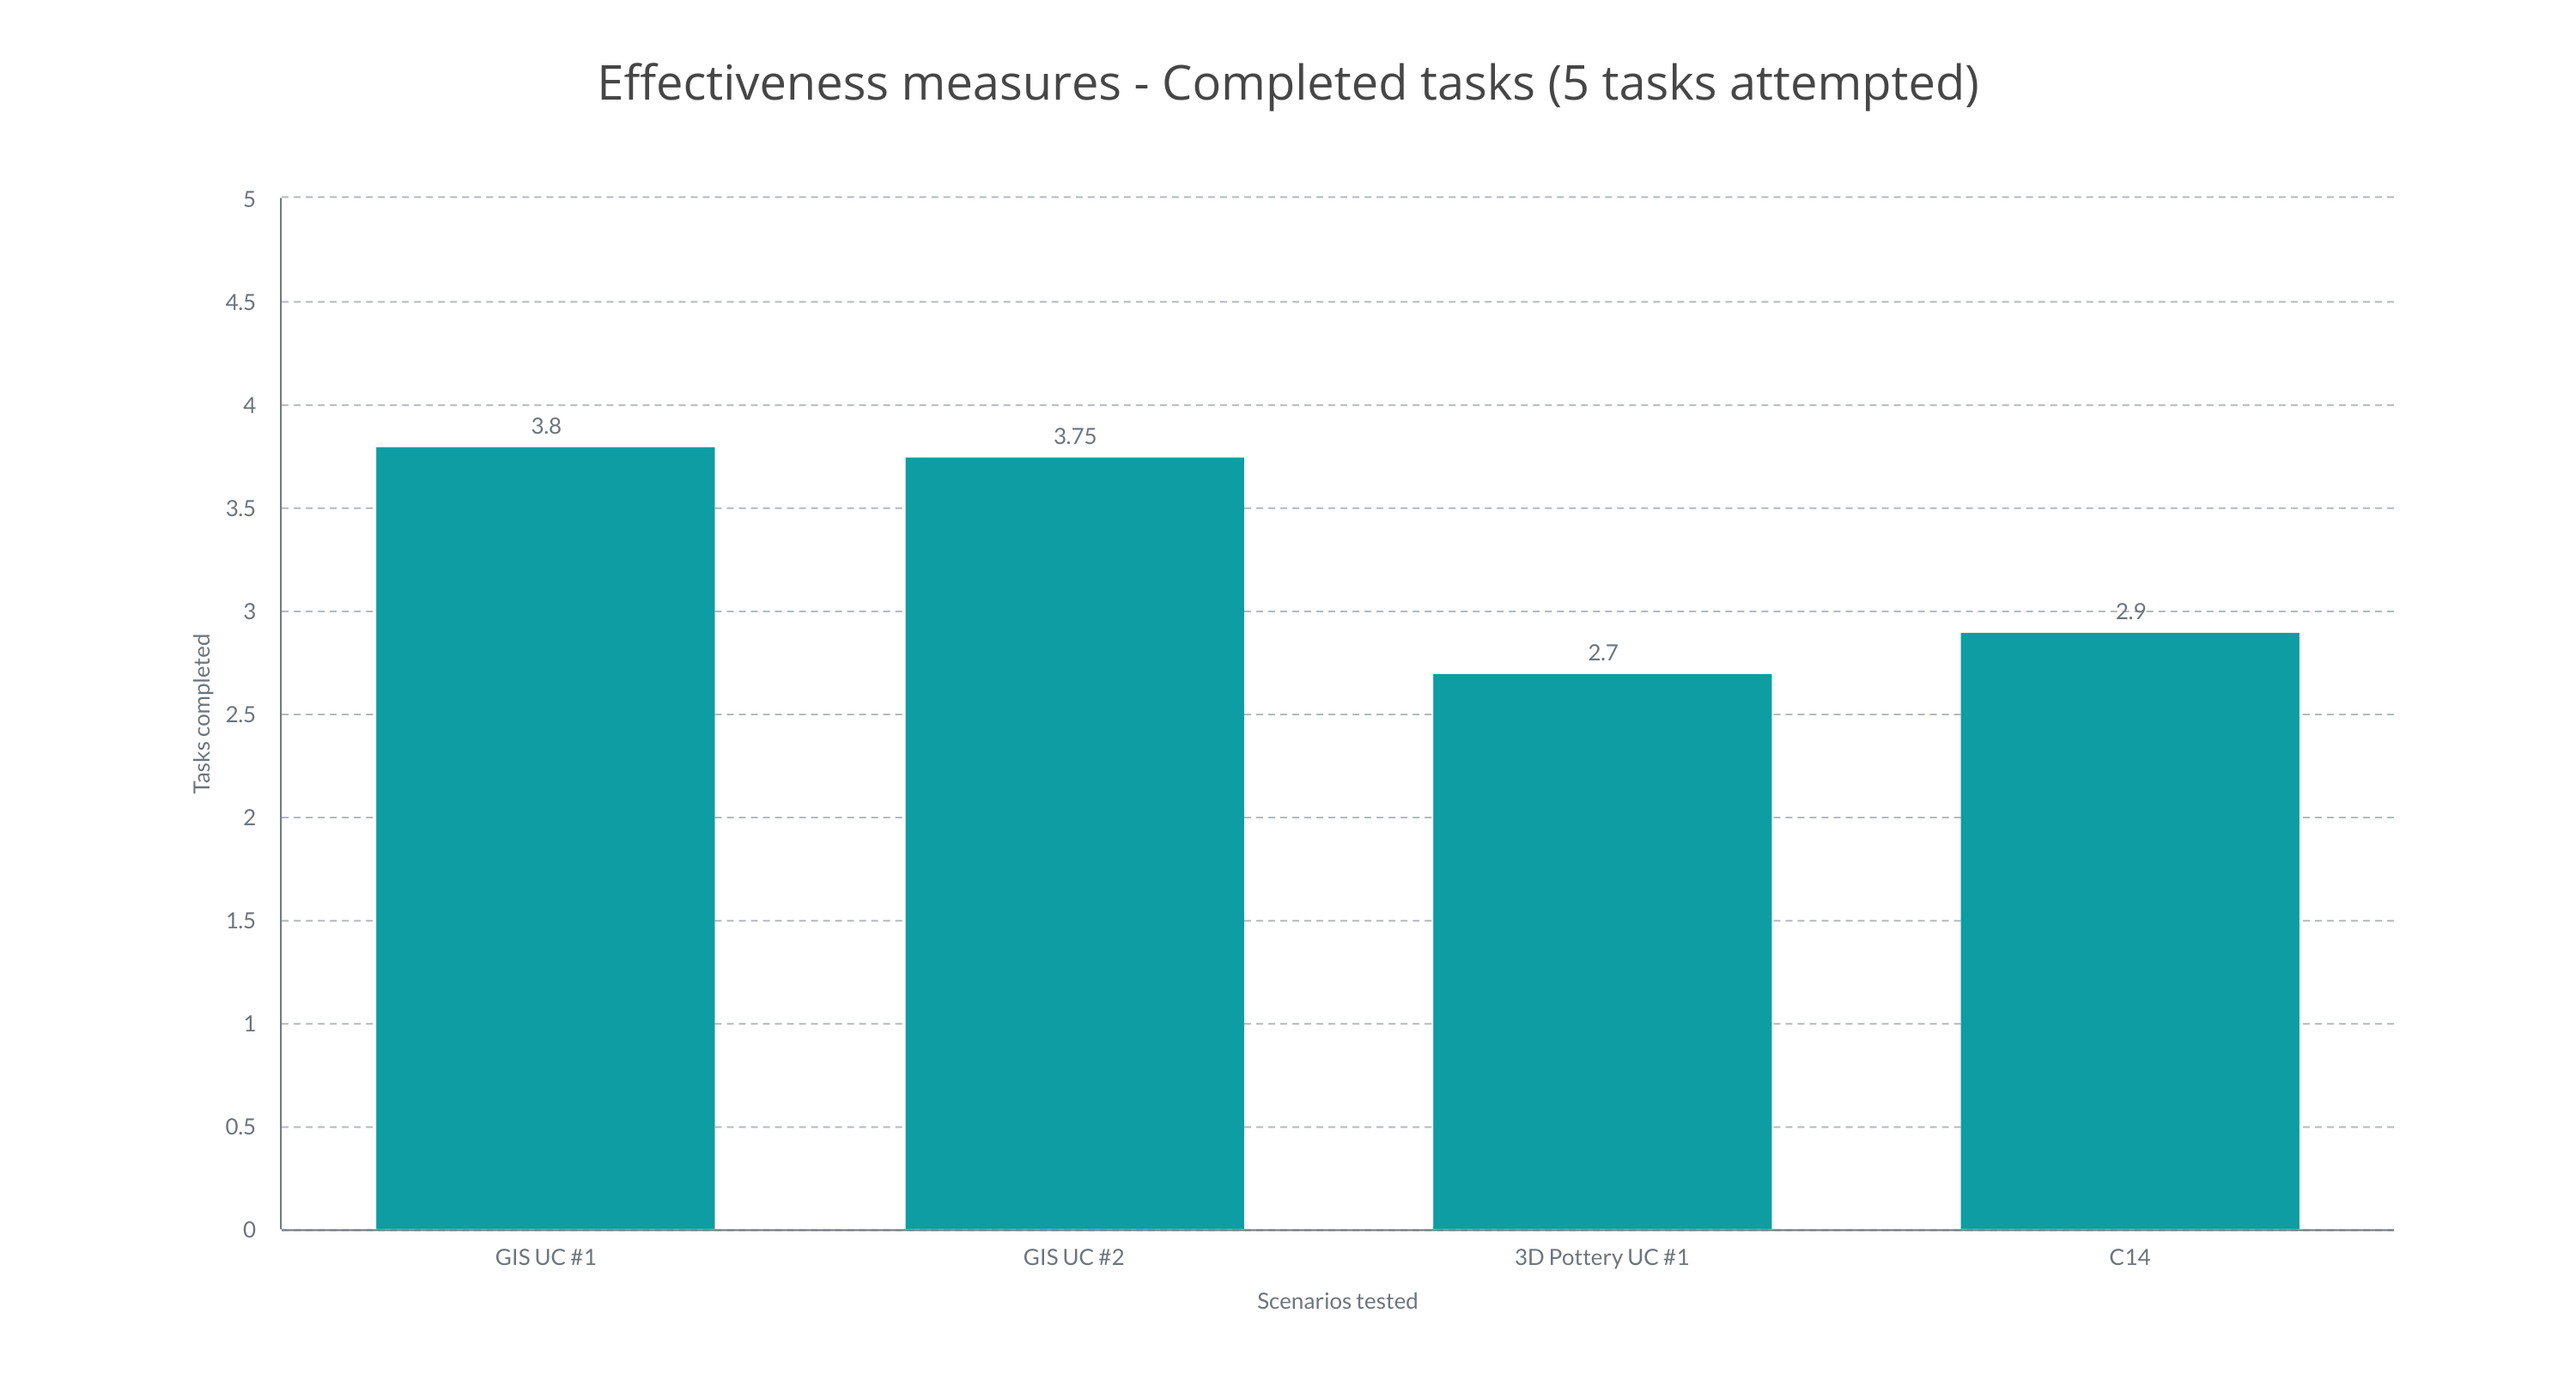
For example, for the 3D Pottery #1 scenario, 15 responses were received, and seven of these respondents could not locate any 3D Pottery models on the platform they were testing. However, these respondents could complete other unrelated tasks, such as filtering search results by material or chronology or locating generic licensing information. Another user commented that despite being unable to find a 3D Pottery model, they completed the tasks using other data from the platform they were testing. Statistically, should responses where the appropriate data not be located be included in the results? In the case of 3D Pottery data, this would decrease the average task completion score from 2.7 to 1.7. However, the GIS scenario scores would remain unchanged, and the radiocarbon scores would decrease from 2.9 to 2.7 tasks completed. Given the difficulty locating 3D Pottery models, a score of 1.7 better reflects the case in trying to work with this type of data.
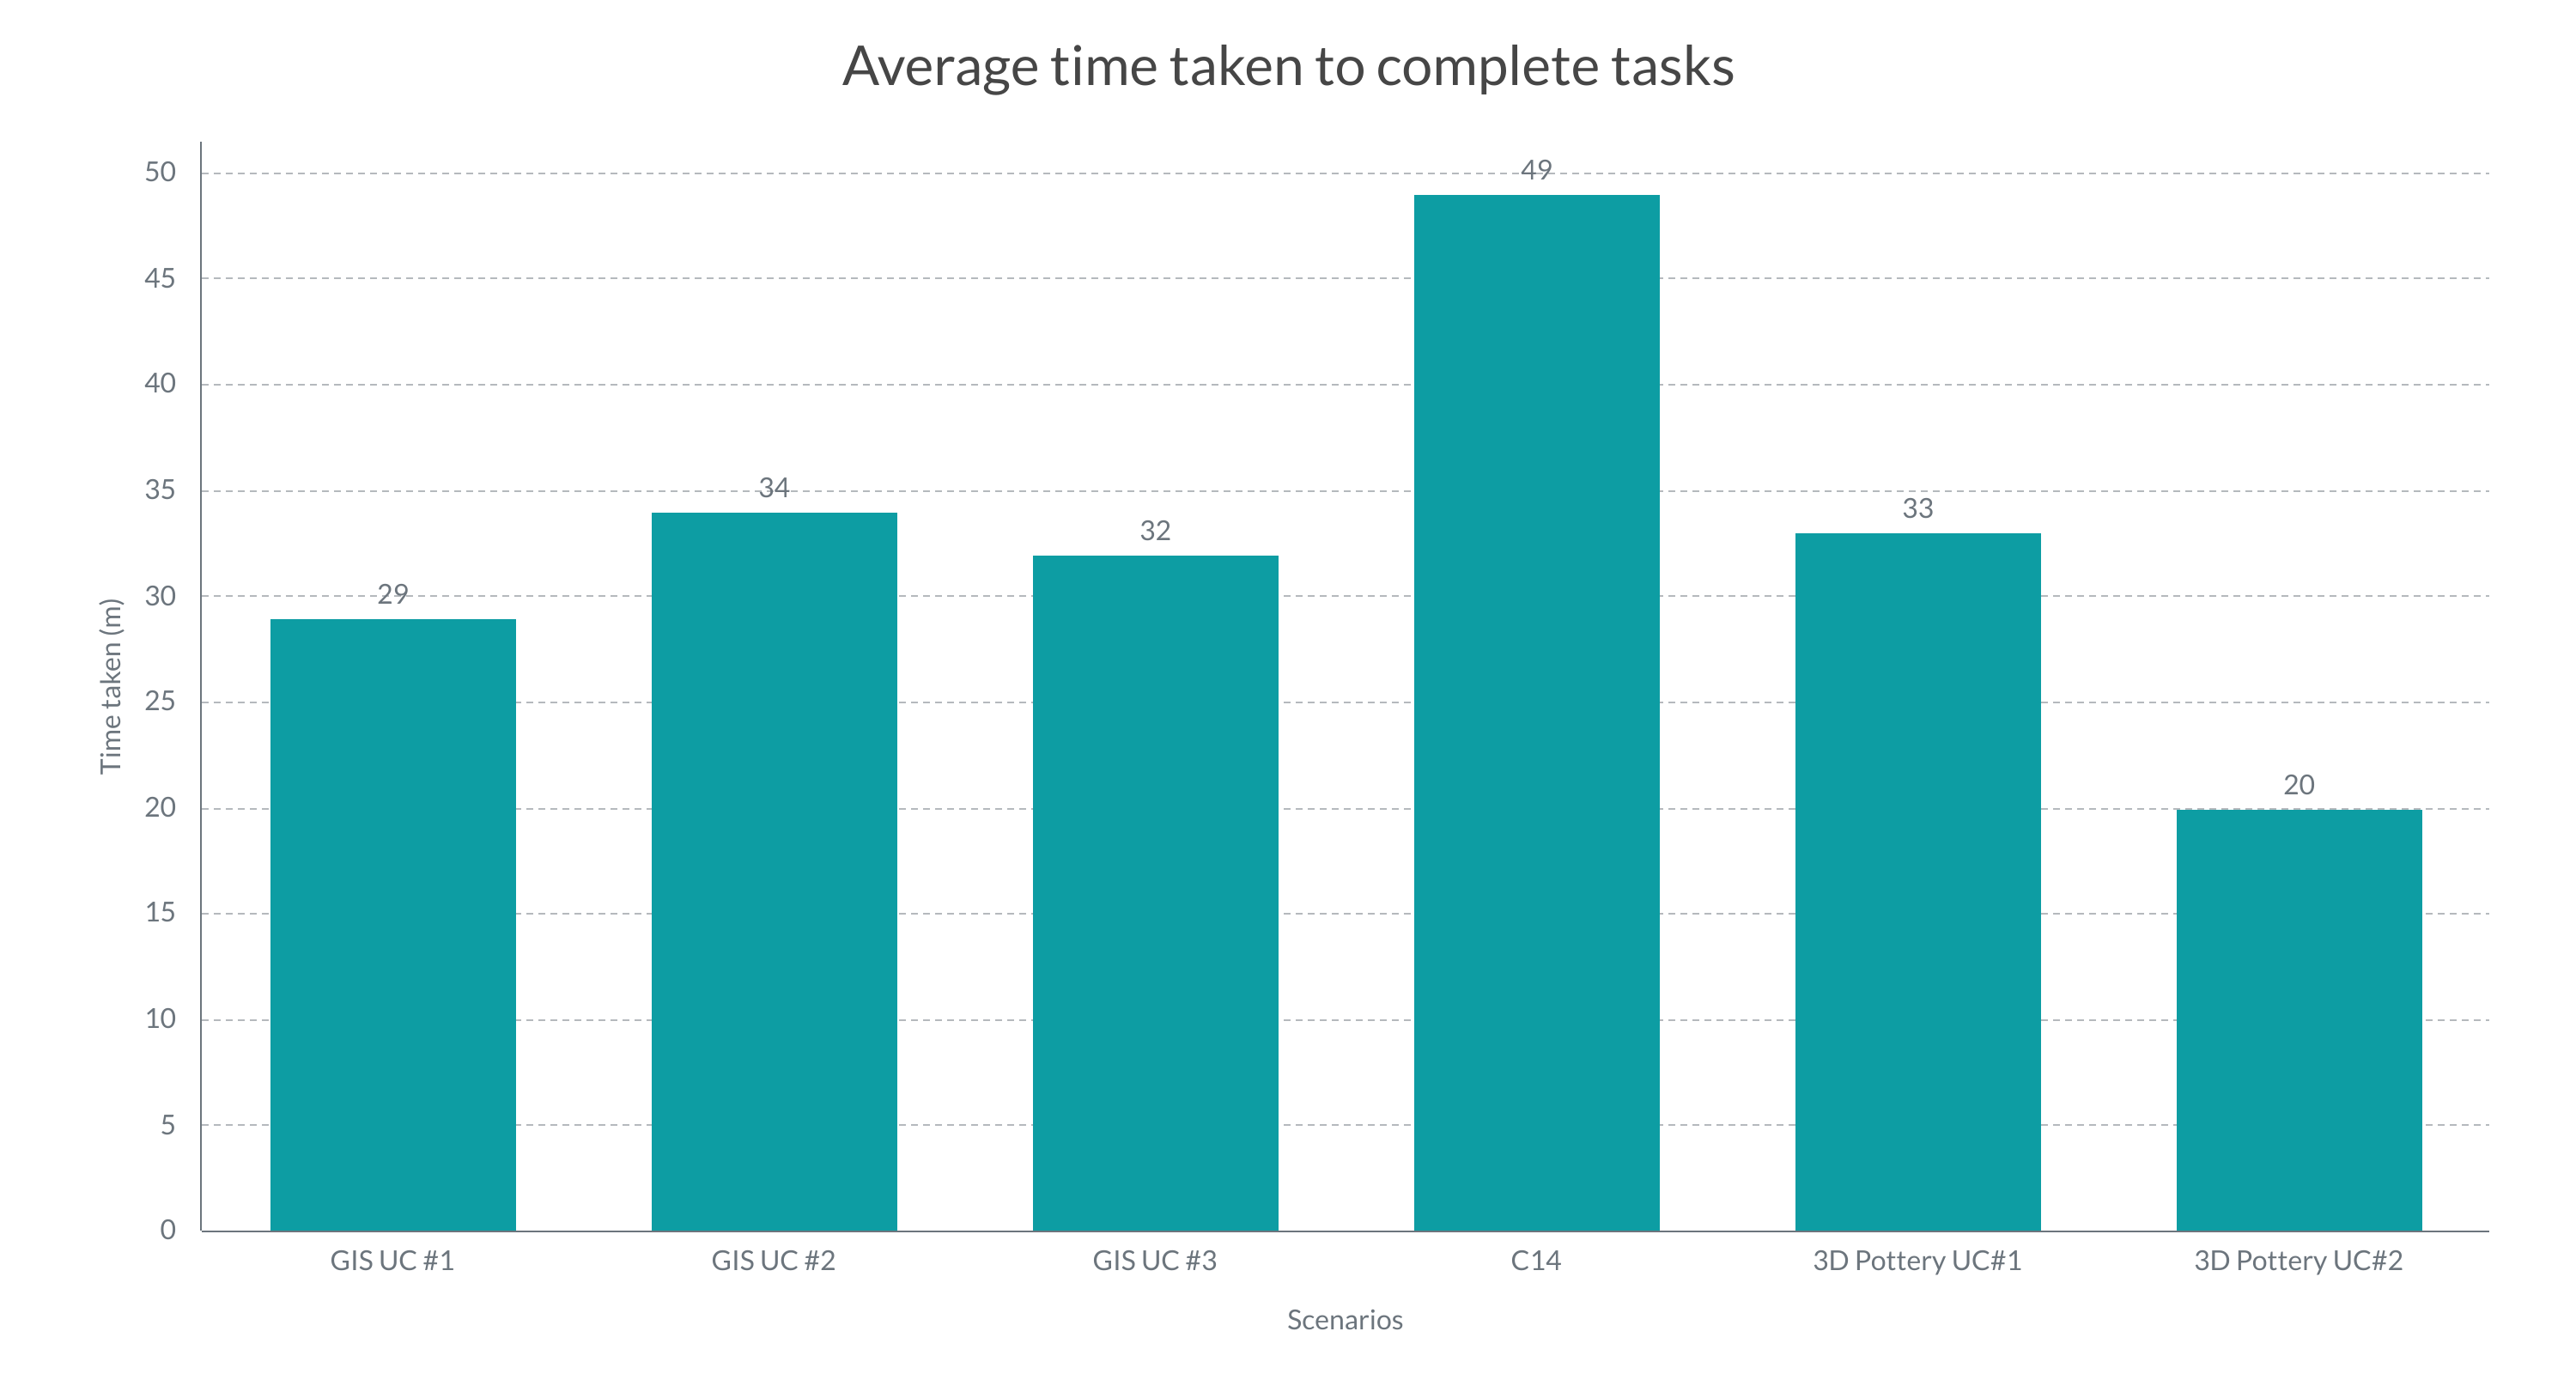
Efficiency is measured to determine the cost of resources required to perform the tasks. Cost can be measured in time, opportunities lost or monetary costs for resources consumed (refer to The British Standards Institution 2016 11-12, for further detail). In this instance, the cost is measured in time. Firstly, efficiency is measured by the average time taken to complete all tasks (Fig. 5).
The second measure calculates the cost, in time, per task (Fig. 6).
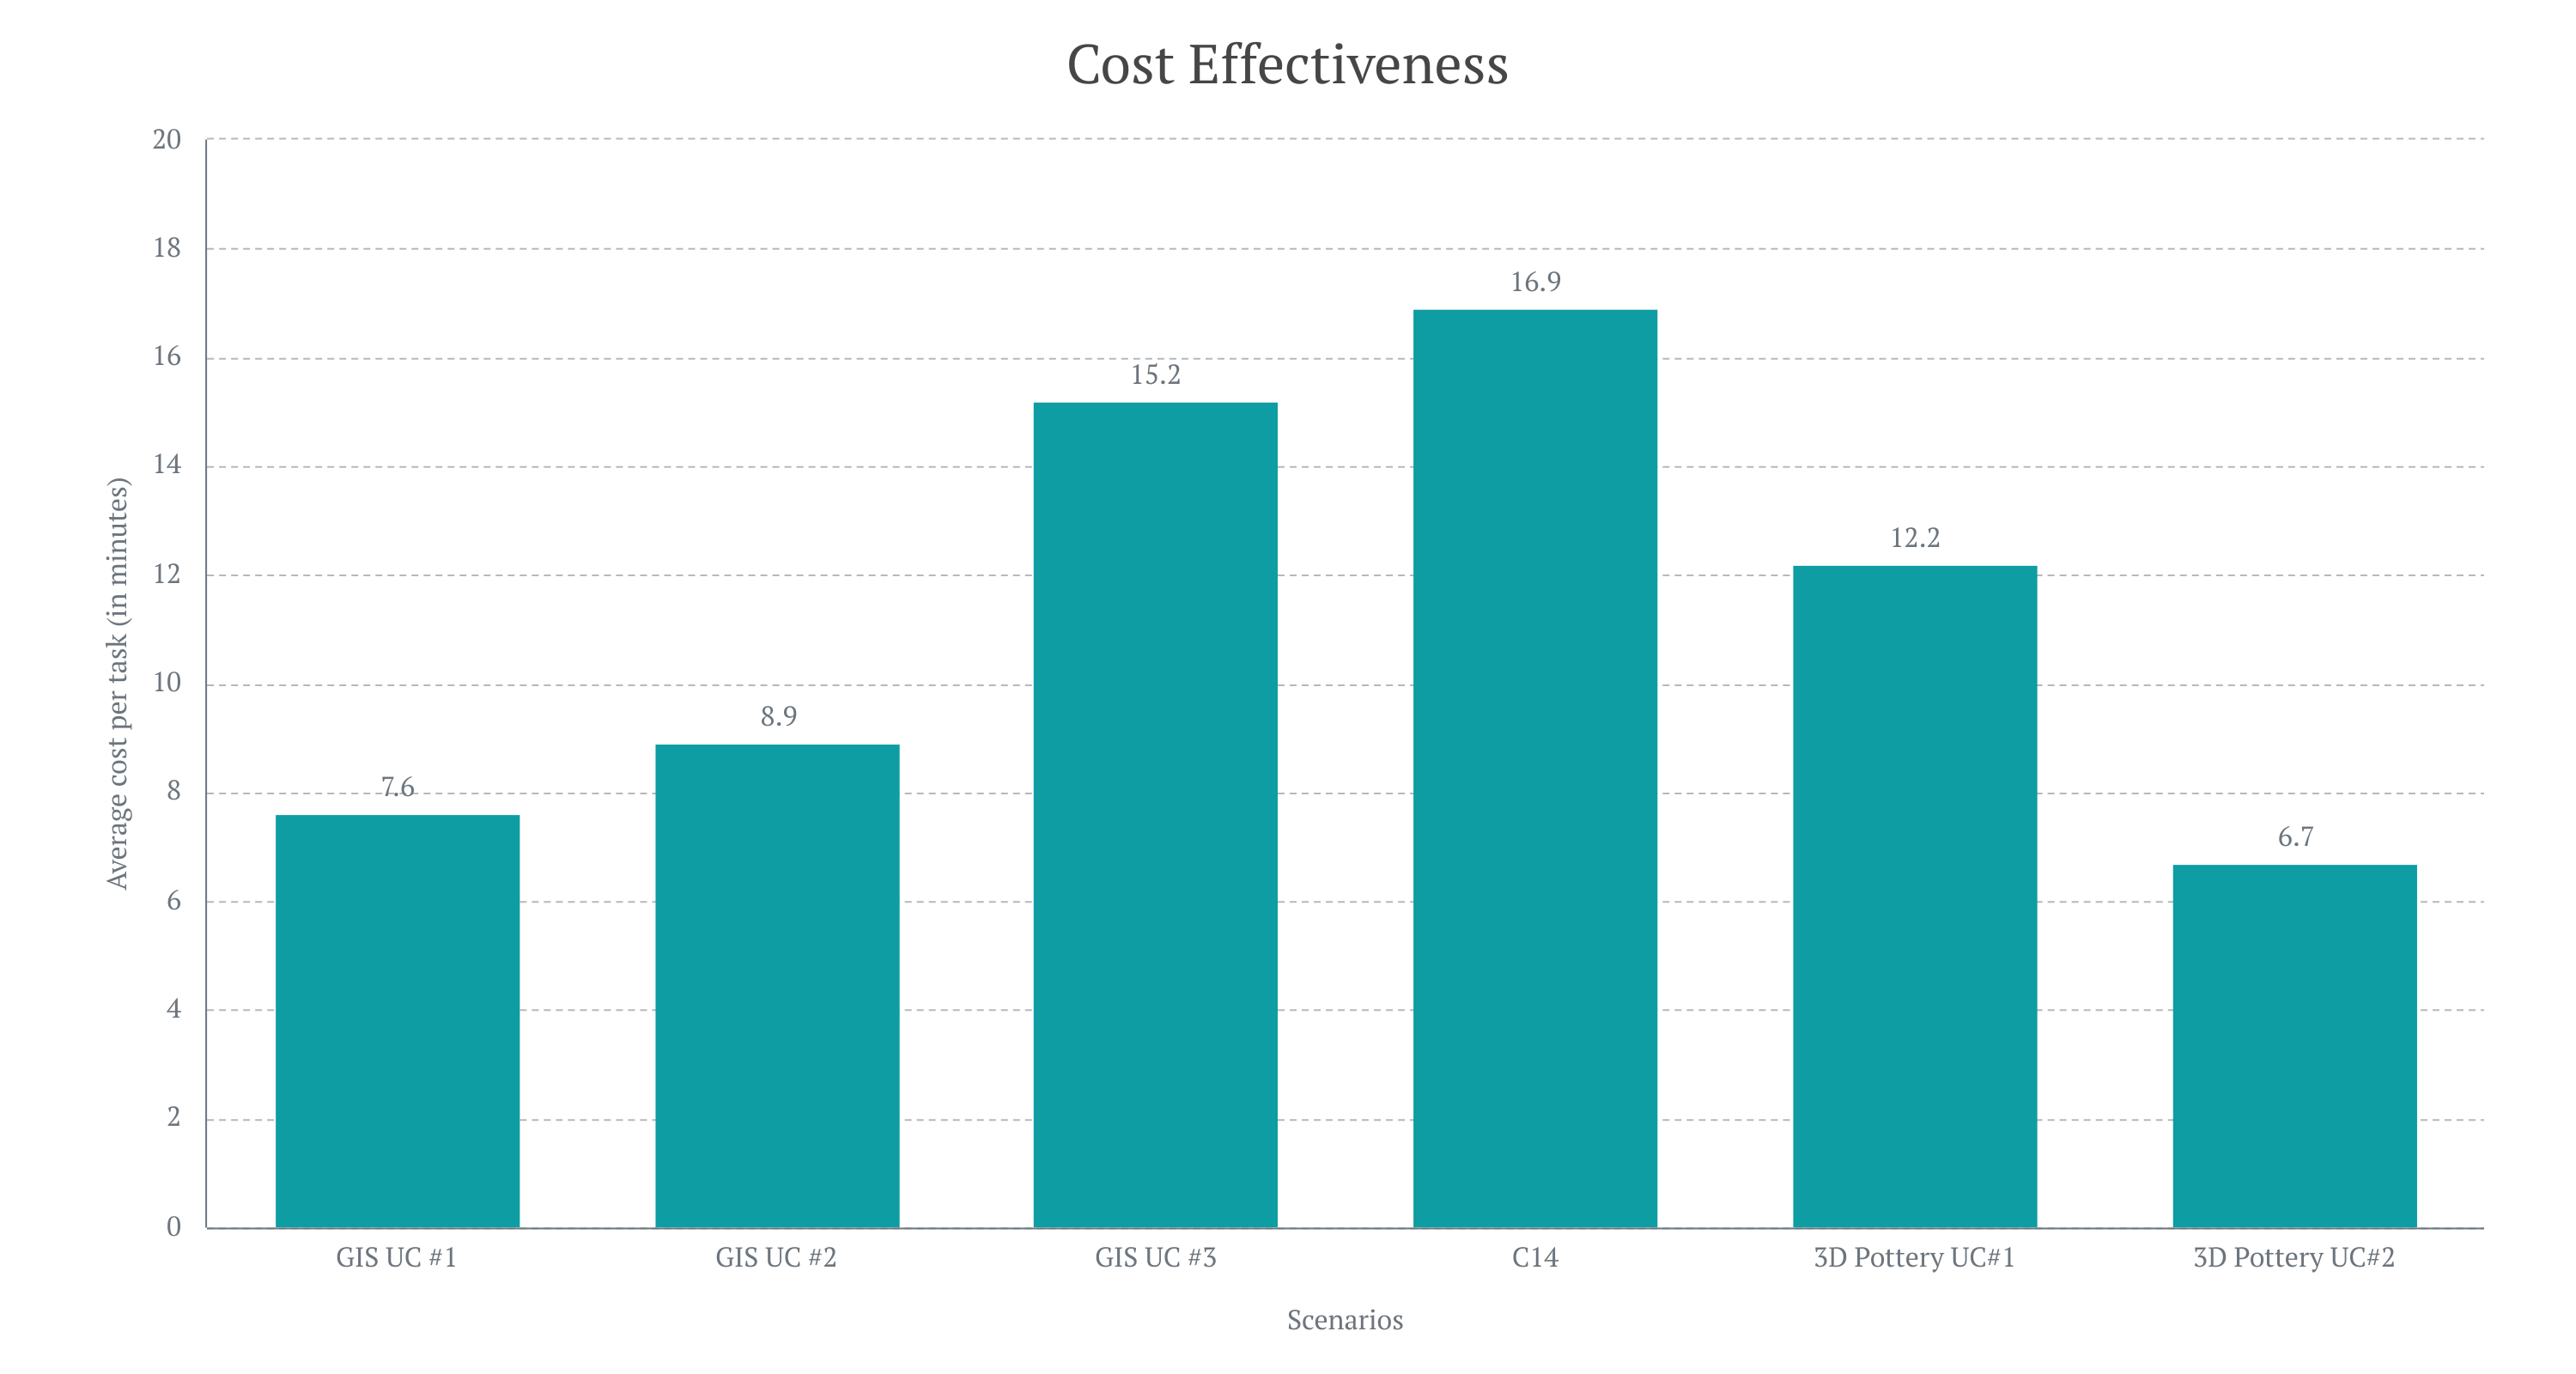
The trend between the two measures is similar for effectiveness. The radiocarbon scenario proved to be the most challenging in terms of efficiency. The radiocarbon respondents took the longest to attempt all tasks, with the longest scenario taking over 80 minutes to complete. The average time taken was 49 minutes, and the cost to complete each task was almost 17 minutes.
The results for user satisfaction were a surprise. There was an expectation that the user community was unsatisfied. The response rate did not reflect this, with responses ranging from neutral to positive (see Table 3 for a comparison of scenarios). Note that the 3D Pottery #2 scenario has been excluded from the comparative analysis as more responses were needed in order to discuss the results in any meaningful way.
| Scenario | Not at all satisfied | Unsatisfied | Neutral | Somewhat satisfied | Extremely satisfied |
|---|---|---|---|---|---|
| GIS #1 | 0 | 4 | 2 | 11 | 4 |
| GIS #2 | 0 | 1 | 4 | 8 | 3 |
| GIS #3 | 2 | 1 | 0 | 4 | 1 |
| 3D Pottery #1 | 1 | 3 | 9 | 2 | 0 |
| 3D Pottery #2 | 0 | 0 | 1 | 1 | 0 |
| C14 | 1 | 2 | 6 | 2 | 0 | Overall Response | 5.5% | 15.1% | 30.1% | 38.4% | 11.0% |
| Scenario | Not at all satisfied | Unsatisfied | Neutral | Somewhat satisfied | Extremely satisfied |
|---|---|---|---|---|---|
| GIS #1 | 0 | 3 | 3 | 12 | 3 |
| GIS #2 | 0 | 3 | 5 | 7 | 1 |
| GIS #3 | 3 | 0 | 1 | 3 | 1 |
| 3D Pottery #1 | 1 | 2 | 7 | 4 | 1 |
| 3D Pottery #2 | 0 | 0 | 1 | 1 | 0 |
| C14 | 1 | 1 | 5 | 4 | 0 | Overall Response | 6.8% | 12.3% | 30.1% | 42.5% | 8.2% |
| Scenario | Not at all satisfied | Unsatisfied | Neutral | Somewhat satisfied | Extremely satisfied |
|---|---|---|---|---|---|
| GIS #1 | 0 | 2 | 5 | 7 | 7 |
| GIS #2 | 0 | 4 | 3 | 6 | 3 |
| GIS #3 | 2 | 0 | 2 | 2 | 2 |
| 3D Pottery #1 | 0 | 0 | 10 | 4 | 1 |
| 3D Pottery #2 | 0 | 0 | 0 | 2 | 0 |
| C14 | 1 | 2 | 3 | 5 | 0 | Overall Response | 4.1% | 11% | 31.5% | 35.6% | 17.8% |
| Scenario | Not at all satisfied | Unsatisfied | Neutral | Somewhat satisfied | Extremely satisfied |
|---|---|---|---|---|---|
| GIS #1 | 5 | 0 | 3 | 8 | 5 |
| GIS #2 | 0 | 0 | 2 | 7 | 7 |
| GIS #3 | 2 | 1 | 0 | 1 | 4 |
| 3D Pottery #1 | 2 | 8 | 3 | 2 | 0 |
| 3D Pottery #2 | 0 | 1 | 0 | 0 | 1 |
| C14 | 2 | 3 | 2 | 2 | 2 | Overall Response | 15.1% | 17.8% | 13.7% | 27.4% | 26.0% |
| Scenario | Not at all satisfied | Unsatisfied | Neutral | Somewhat satisfied | Extremely satisfied |
|---|---|---|---|---|---|
| GIS #1 | 2 | 2 | 6 | 8 | 3 |
| GIS #2 | 0 | 1 | 5 | 7 | 3 |
| GIS #3 | 2 | 1 | 0 | 1 | 4 |
| 3D Pottery #1 | 1 | 4 | 7 | 3 | 0 |
| 3D Pottery #2 | 0 | 0 | 1 | 1 | 0 |
| C14 | 1 | 1 | 4 | 5 | 0 | Overall Response | 8.2% | 12.3% | 31.5% | 34.2% | 13.7% |
| Scenario | Not at all satisfied | Unsatisfied | Neutral | Somewhat satisfied | Extremely satisfied |
|---|---|---|---|---|---|
| GIS #1 | 0 | 4 | 2 | 11 | 4 |
| GIS #2 | 0 | 1 | 4 | 8 | 3 |
| GIS #3 | 2 | 1 | 0 | 4 | 1 |
| 3D Pottery #1 | 1 | 3 | 9 | 2 | 0 |
| 3D Pottery #2 | 0 | 0 | 1 | 1 | 0 |
| C14 | 1 | 2 | 6 | 2 | 0 | Overall Response | 5.5% | 15.1% | 30.1% | 38.4% | 11.0% |
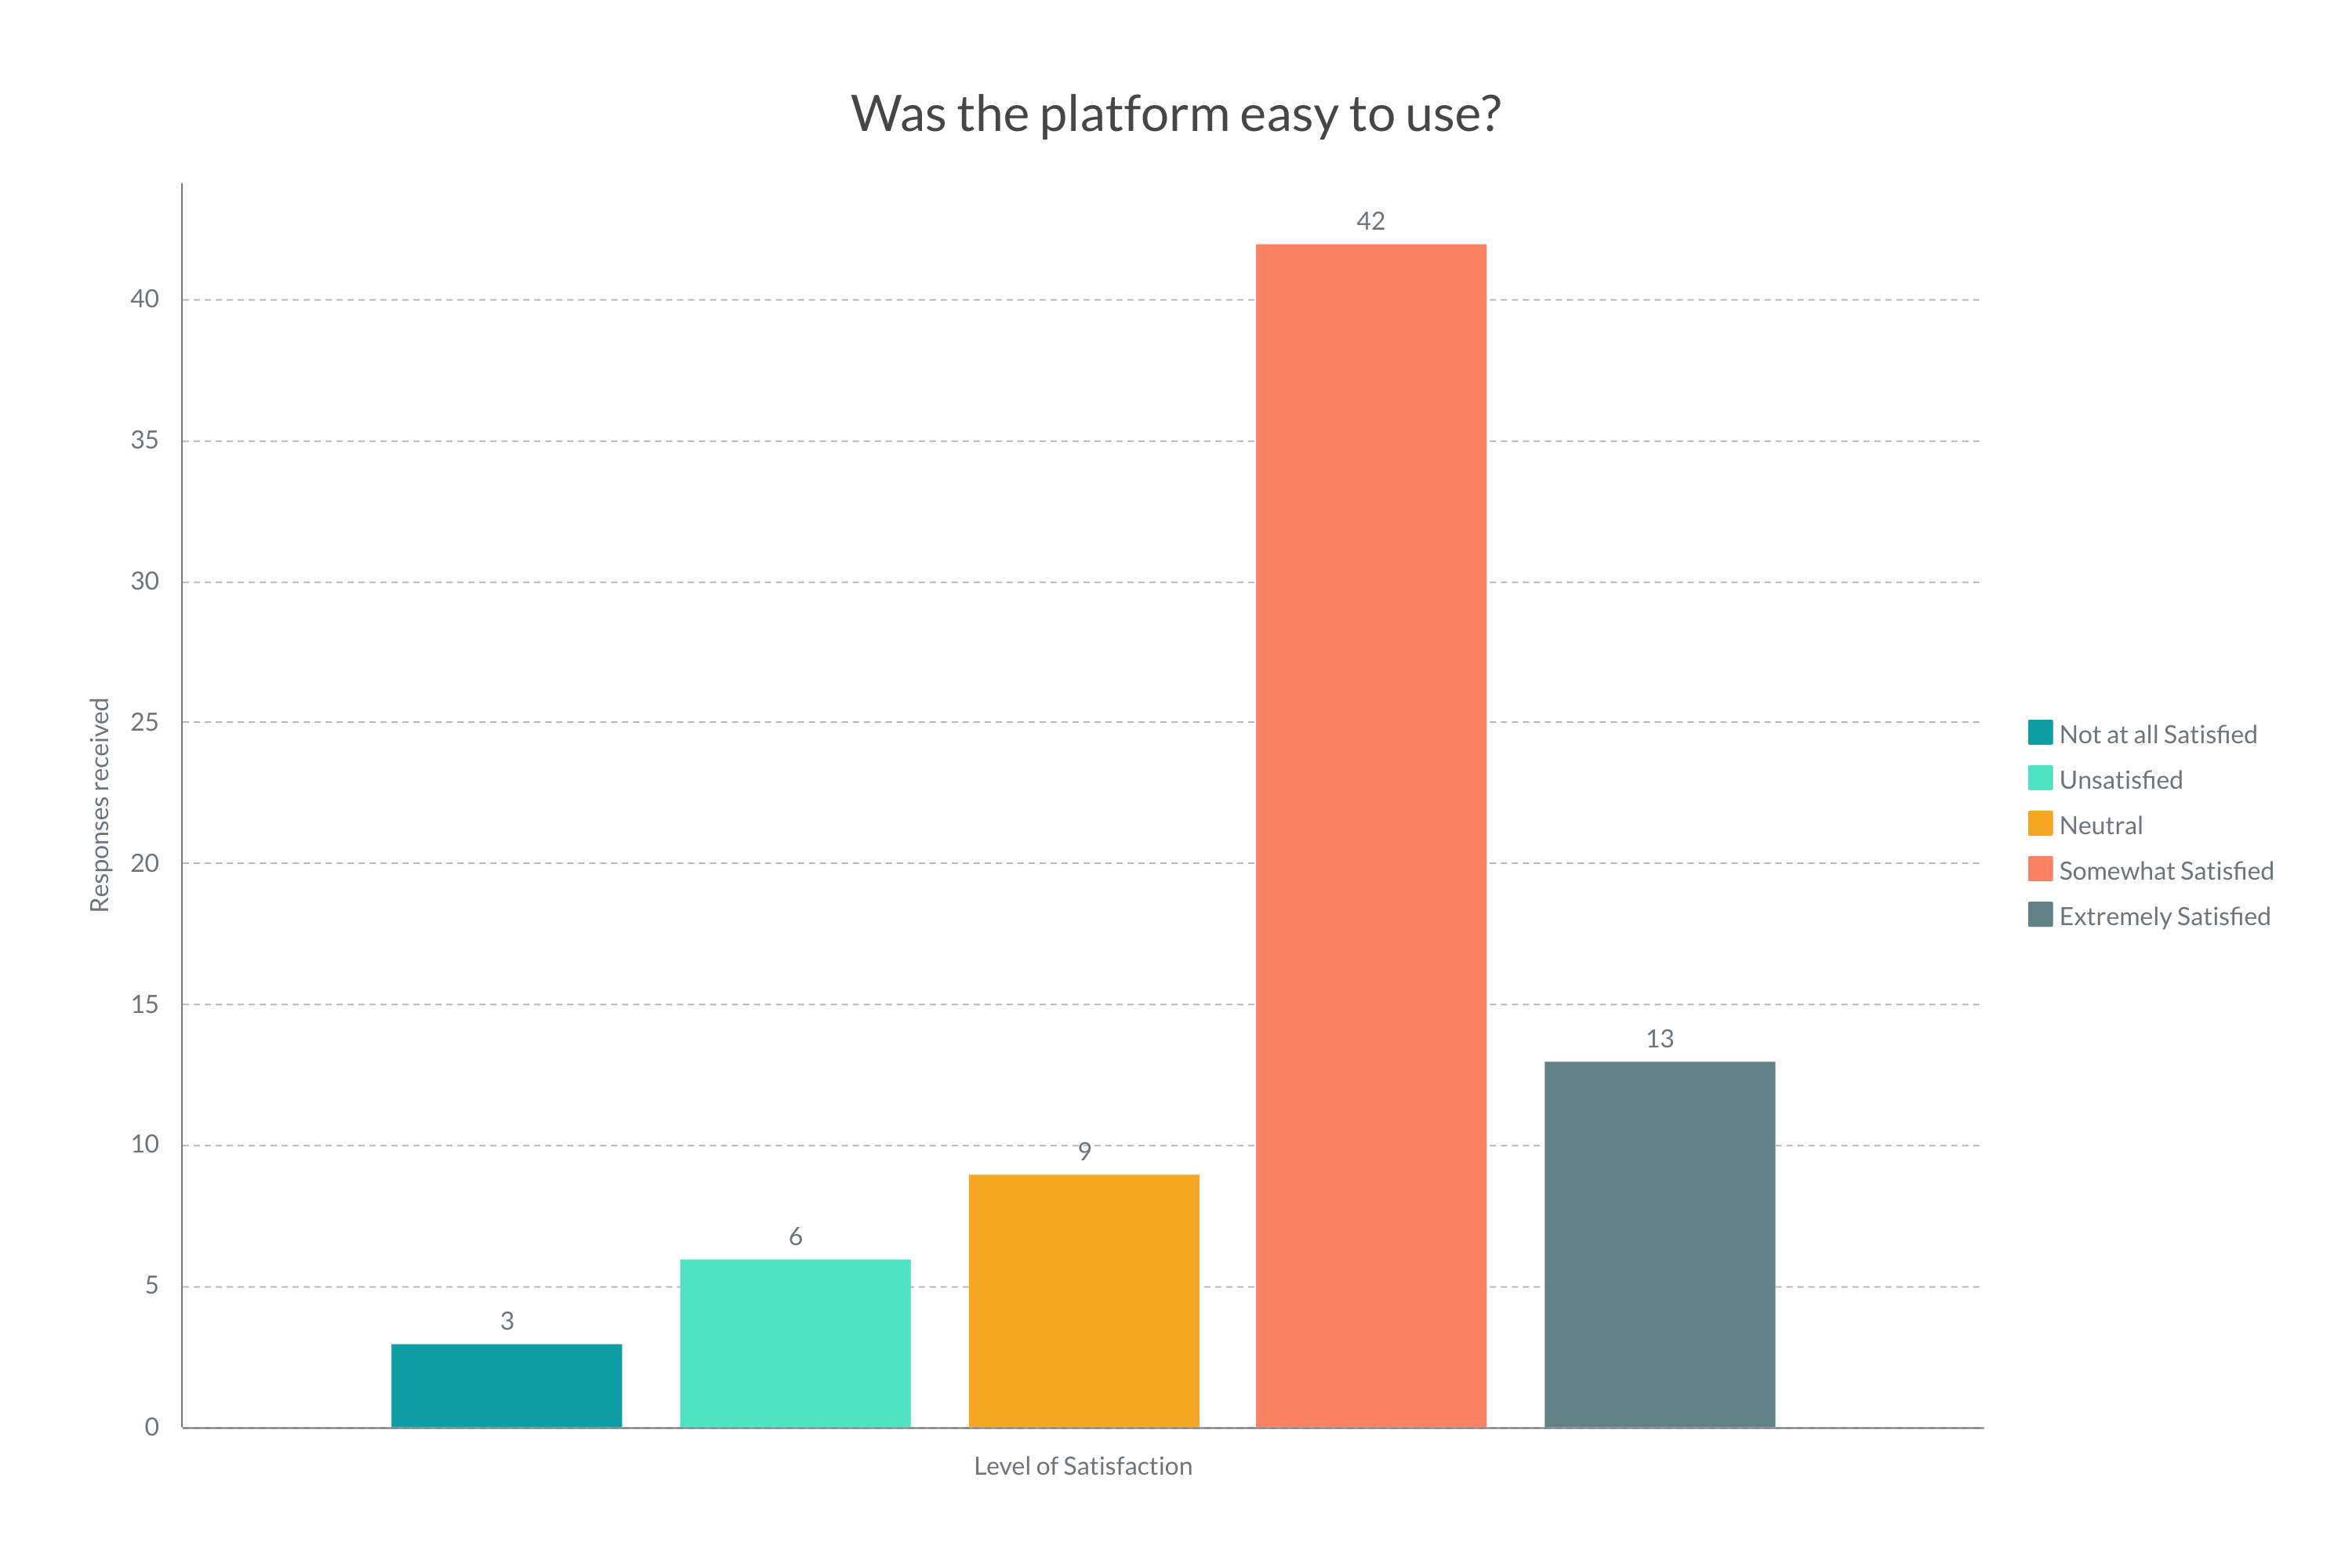
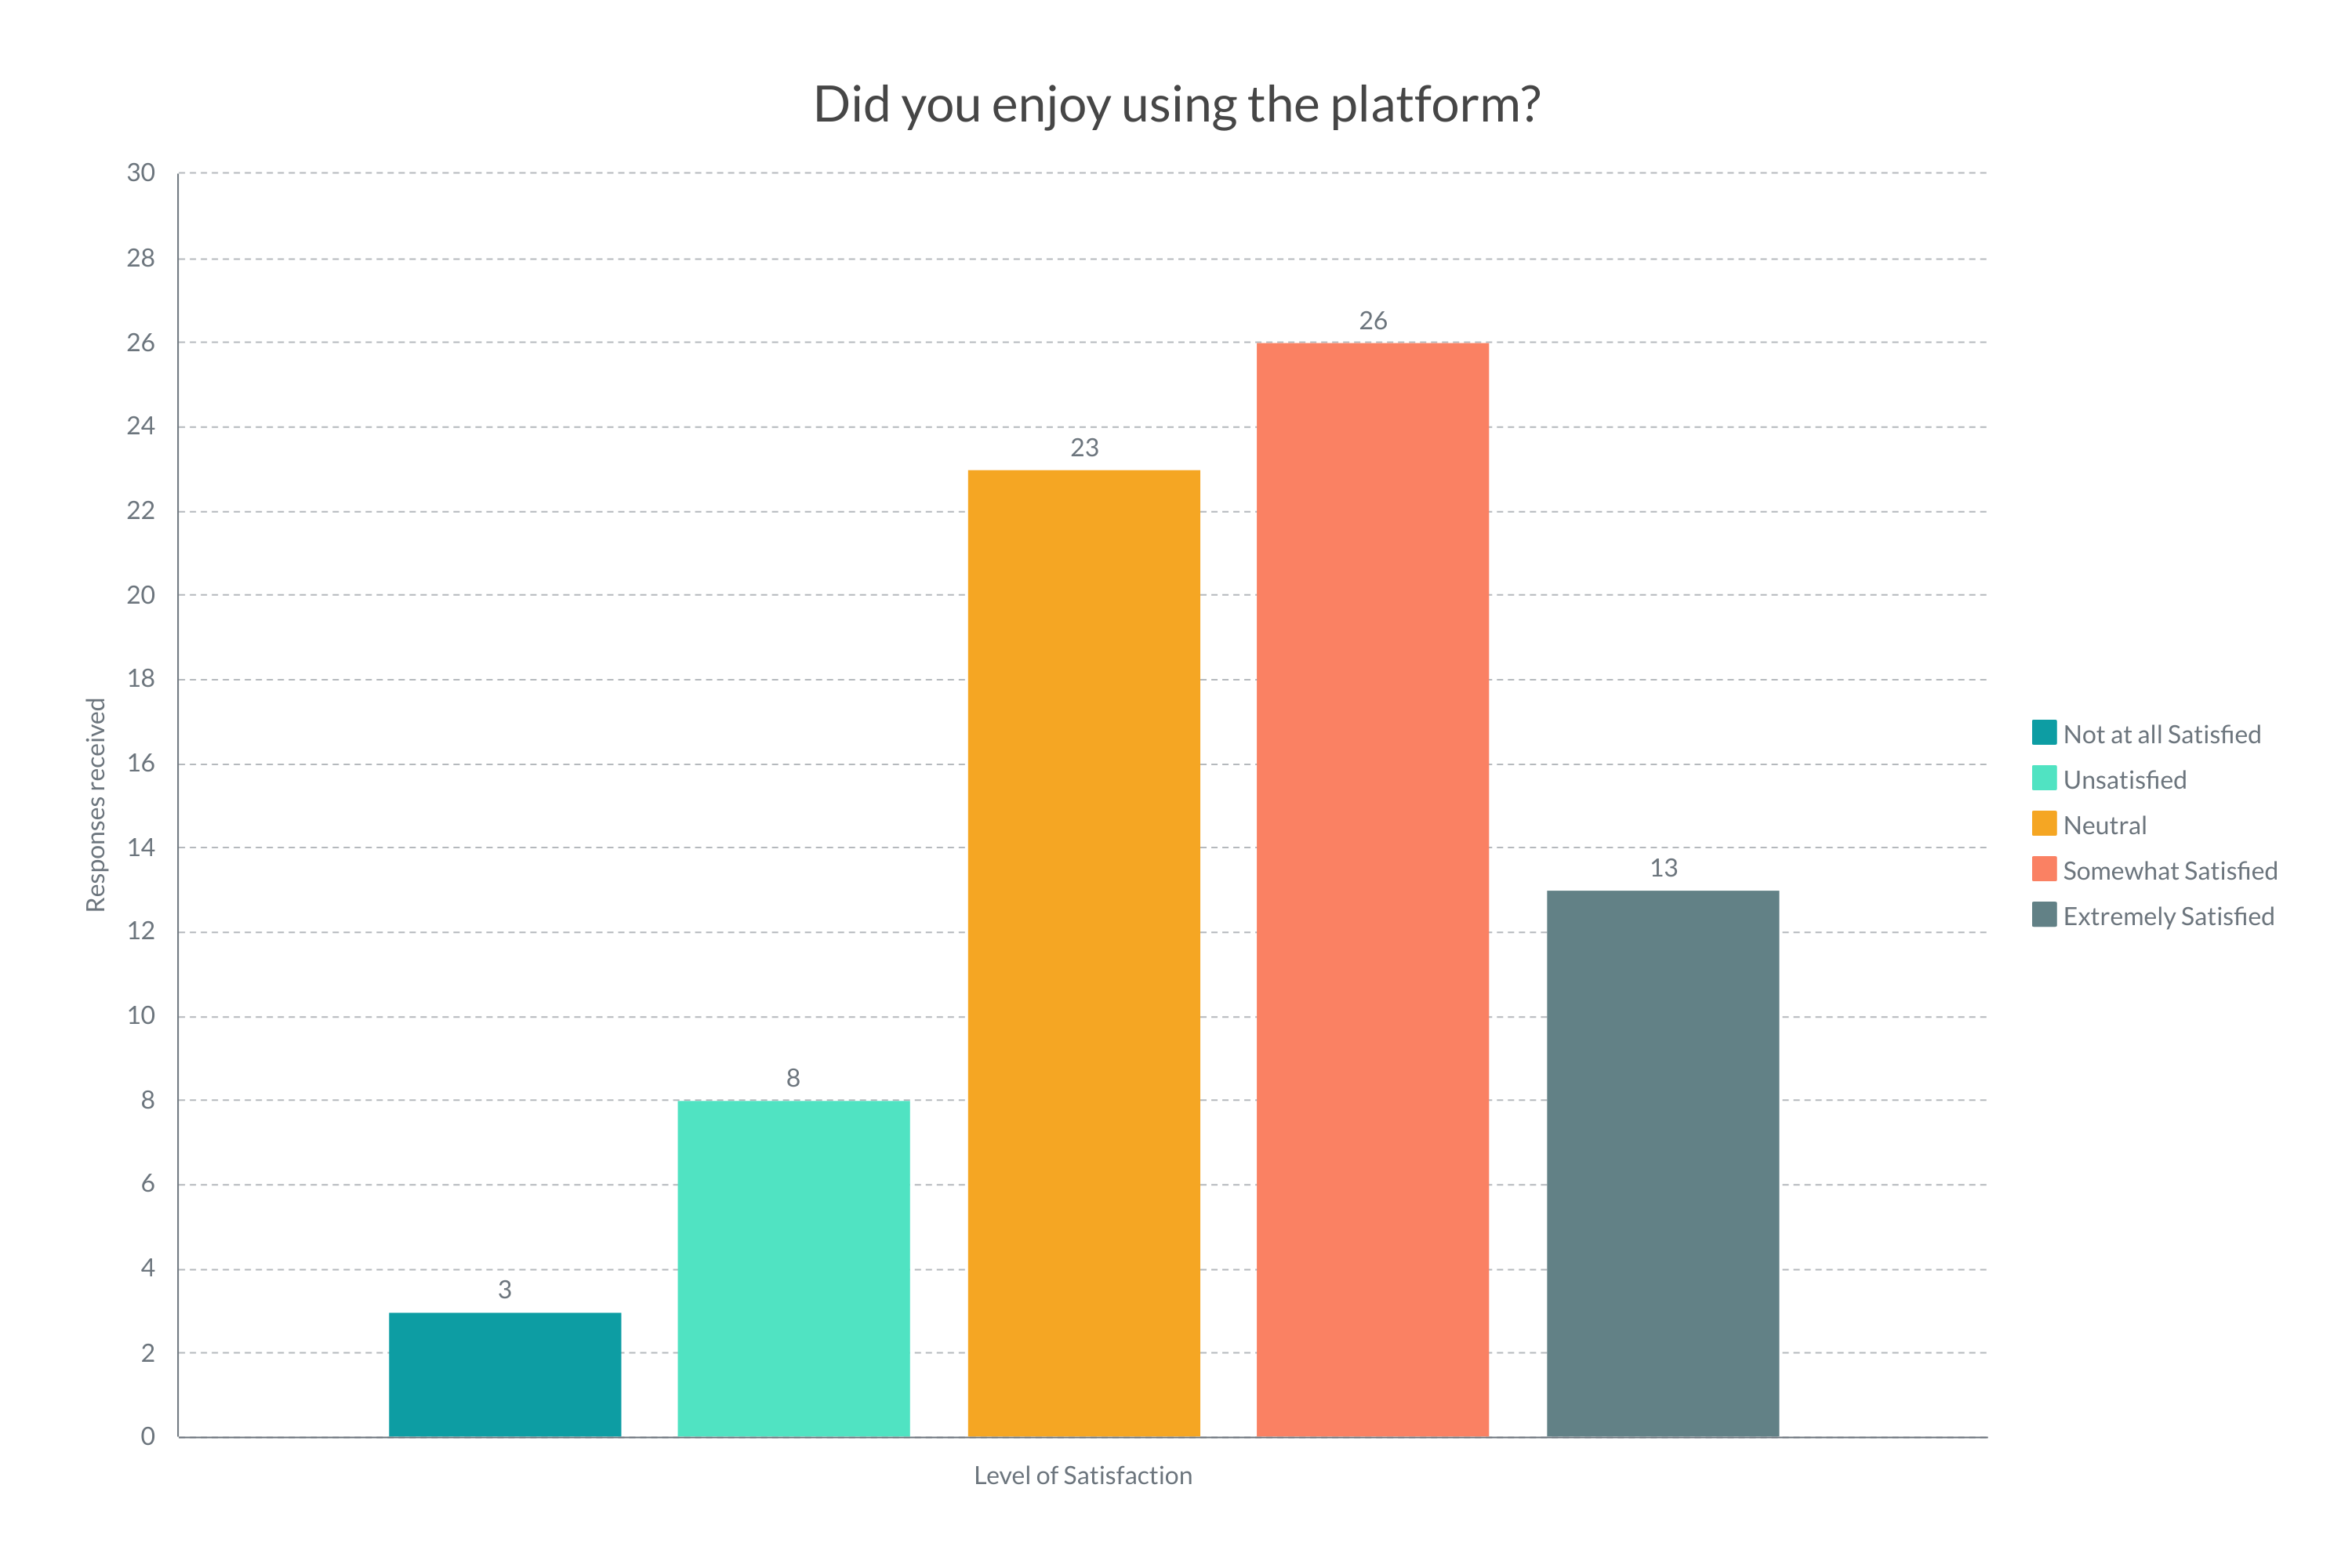
The majority of respondents, 75% (n=55), scored somewhat satisfied or extremely satisfied with the ease of platform use (Fig. 7). This trend was seen across most scenarios, with slightly higher satisfaction with the 3D Pottery scenario. These respondents made comments on design and presentation features. Respondents who gave a low score commented on the functionality of platforms or an inability to locate an appropriate dataset.
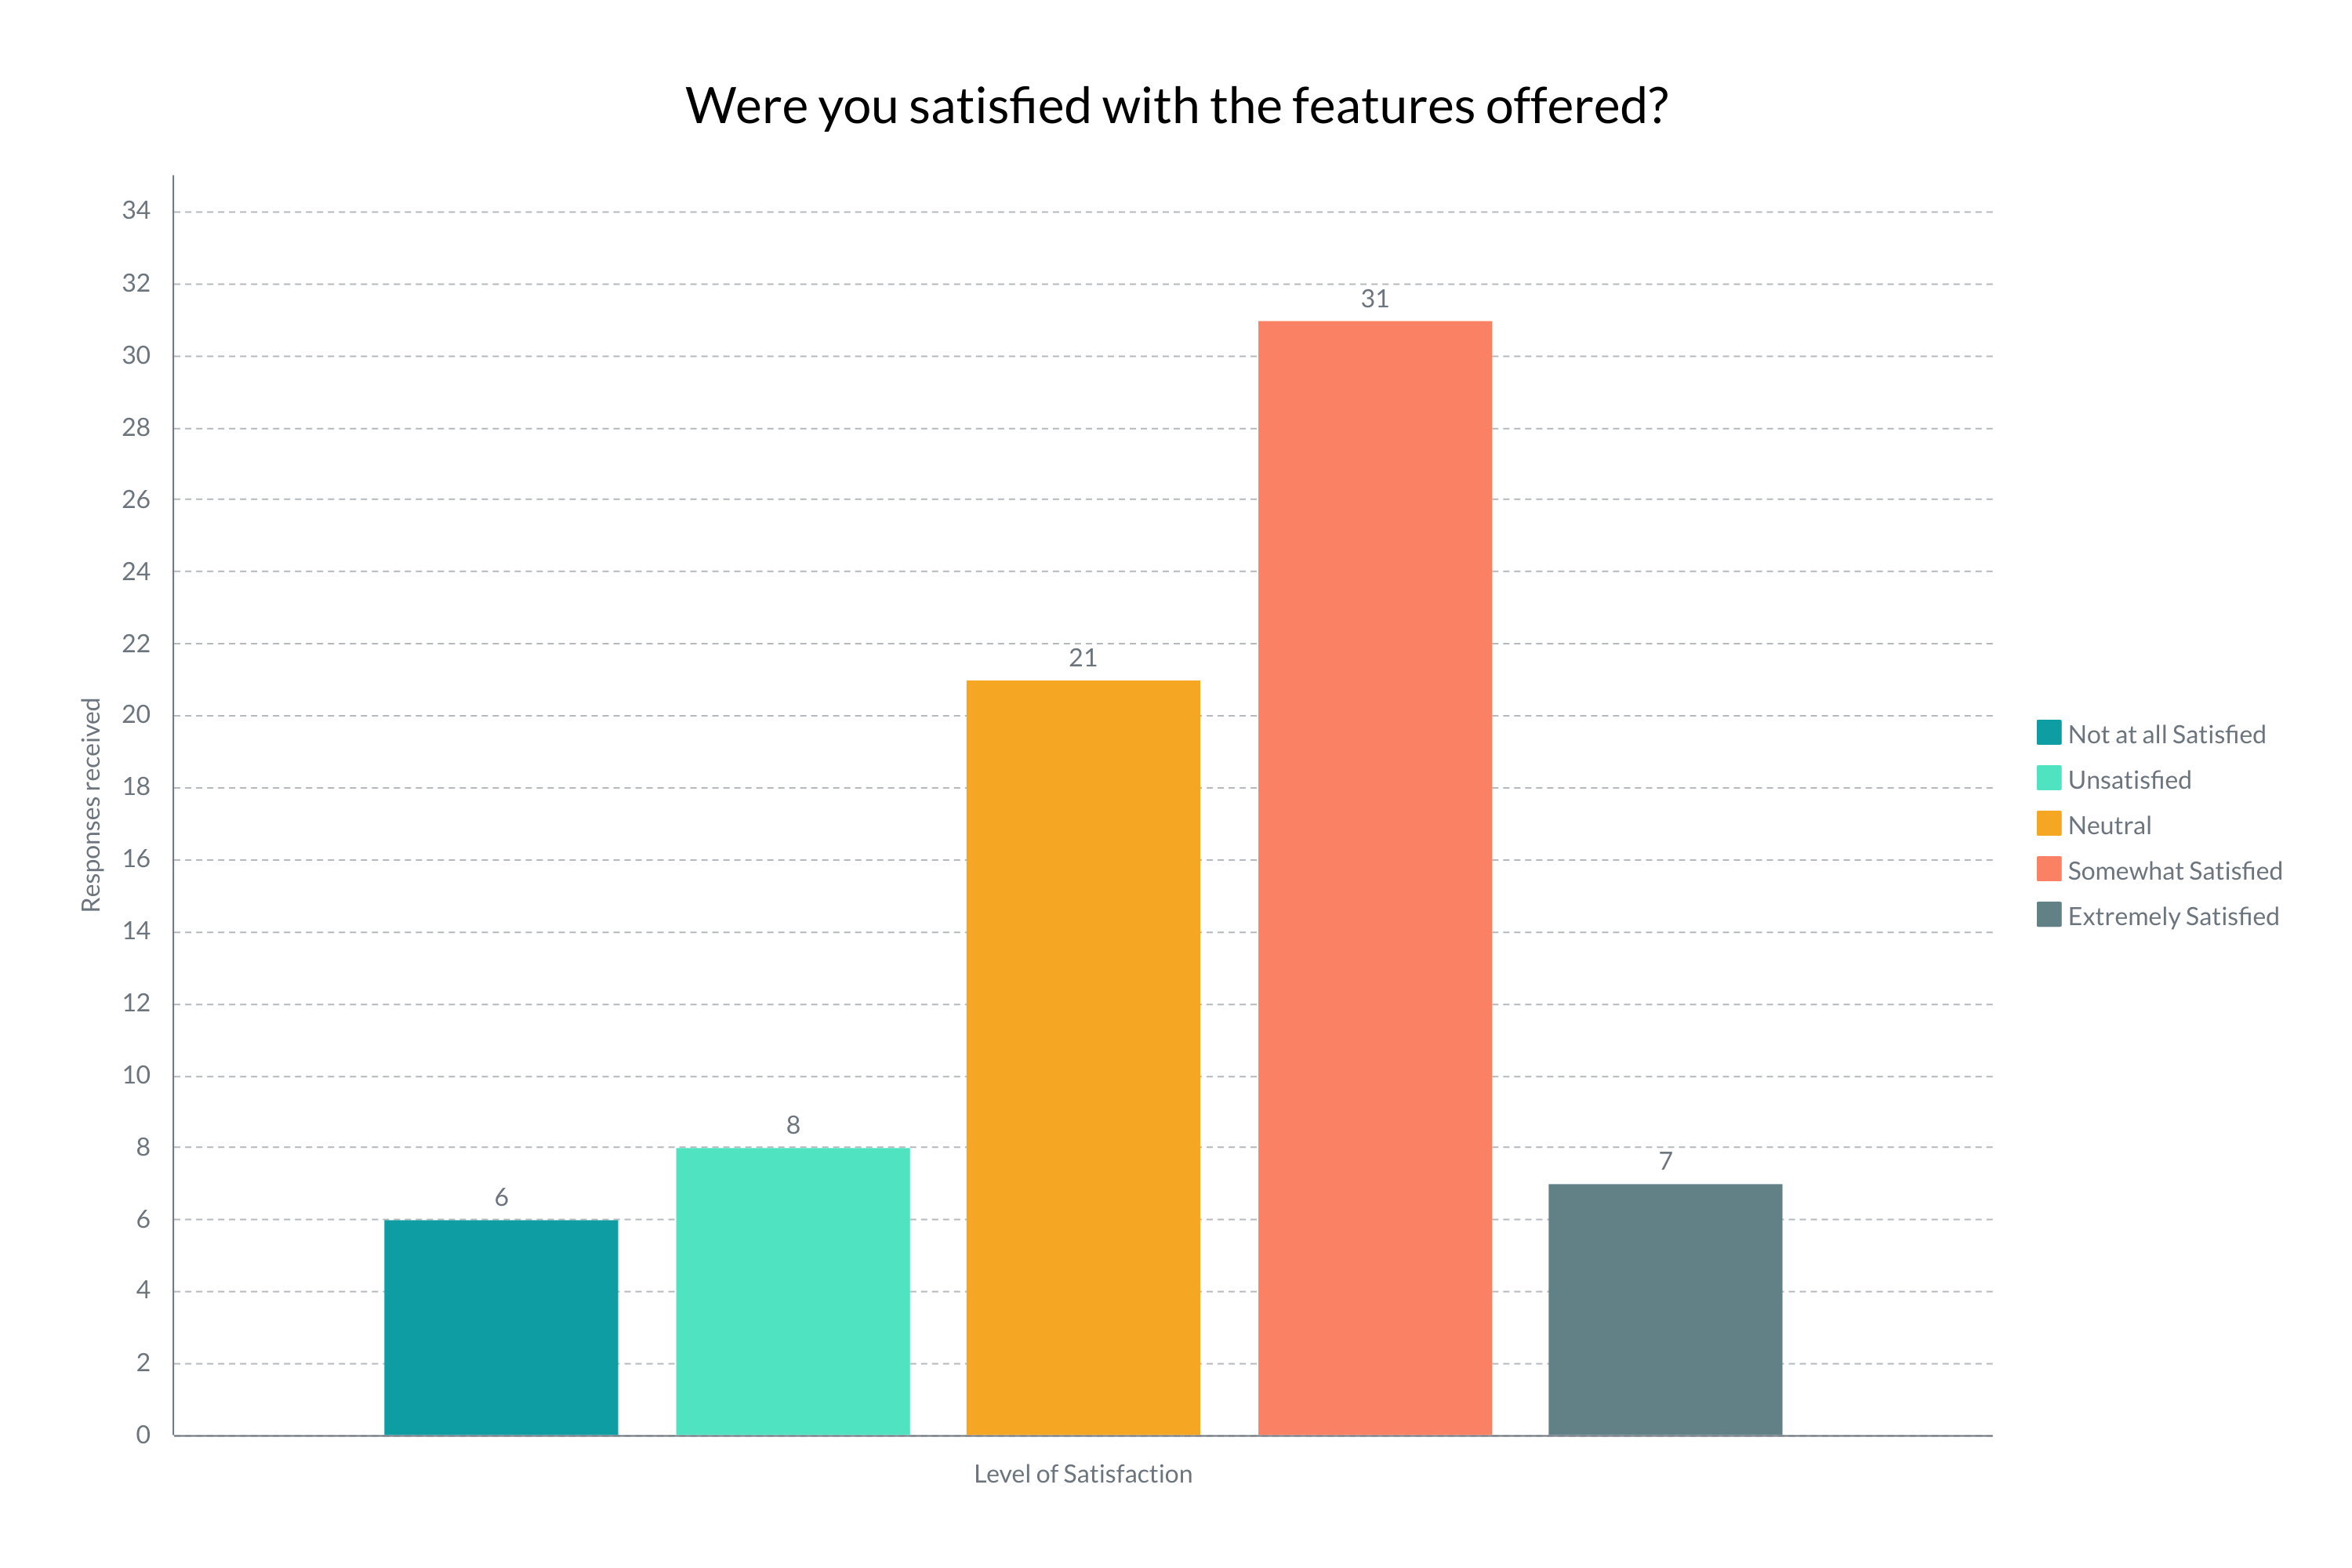
When asked about satisfaction with the features offered, 30% (n=21) of respondents scored a three, which increased to 73% (n=52) if somewhat satisfied scores were included (Fig. 8). Respondents for the GIS web services scenario commented that the survey did not apply to the tested service, with 37% of respondents scoring as not at all satisfied. Other comments stated that the data were available but not reusable, the data could not be exported, or there needed to be more resources for archaeologists. This sentiment was echoed elsewhere with respondents of other scenarios who scored more neutrally across the board.
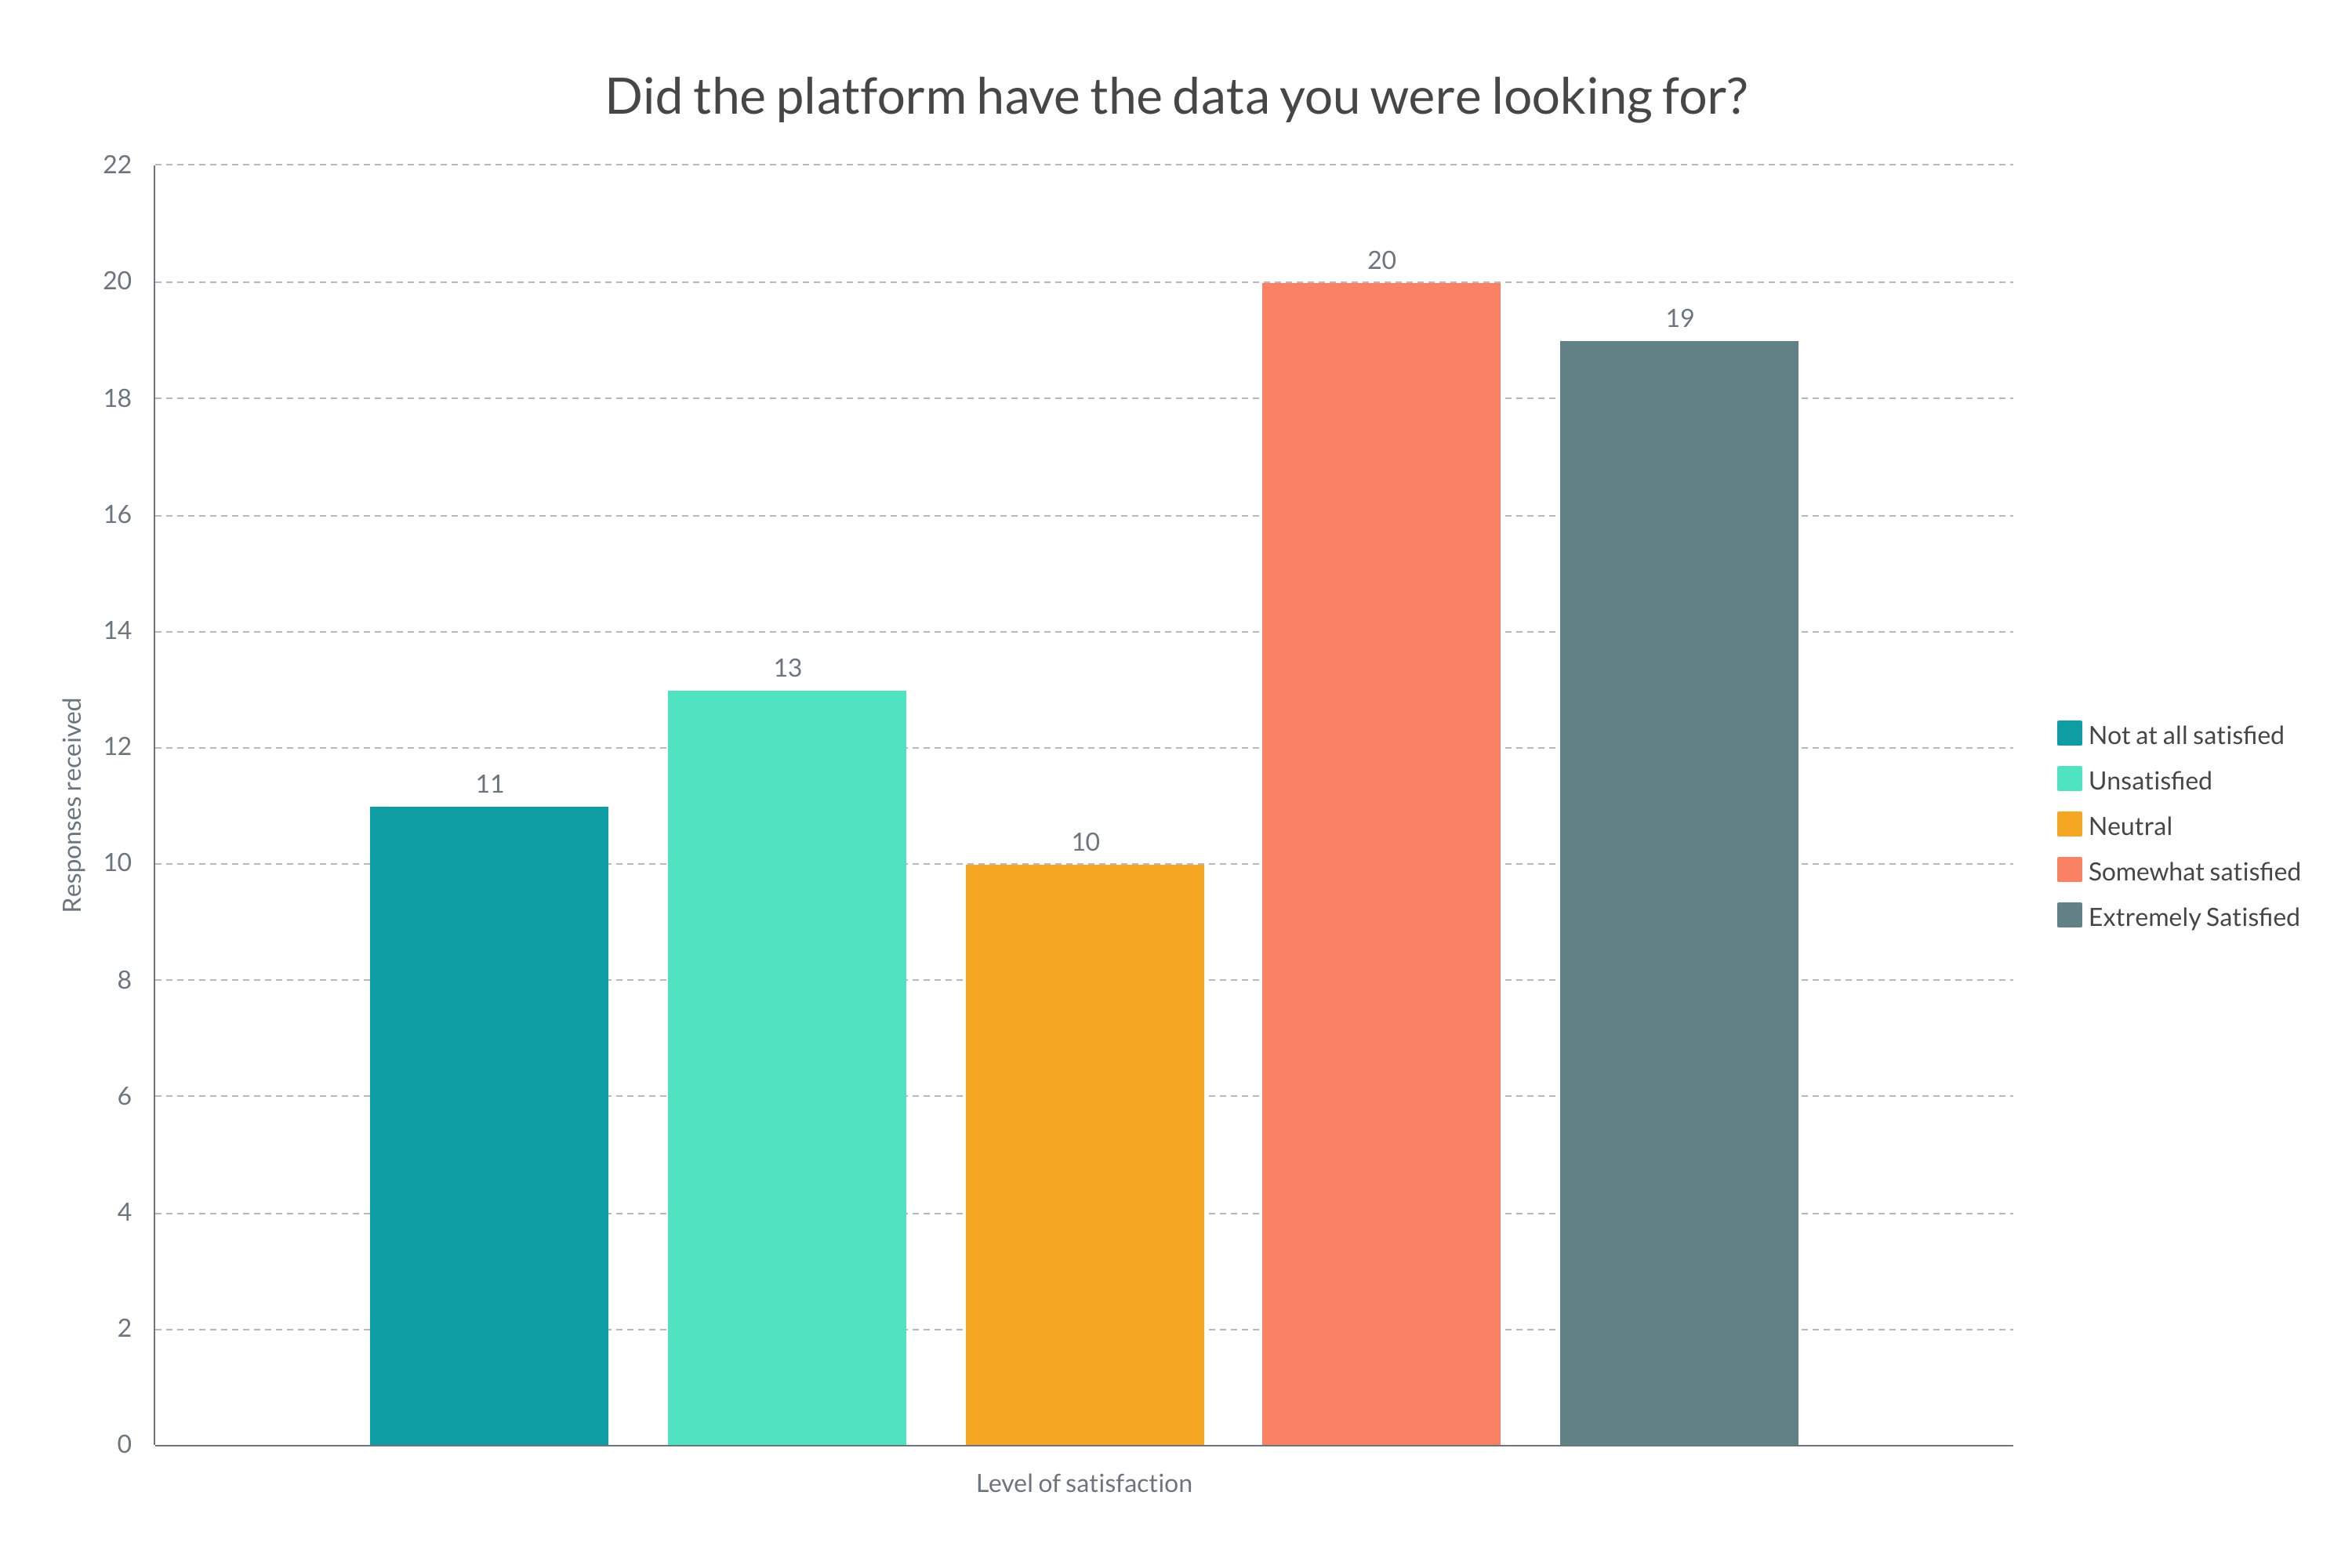
In general, a low response rate was given for this question, particularly for the GIS scenarios, with 25% (n=4) of respondents selecting unsatisfied or not at all satisfied (Fig. 9). The comments noted a need for more available datasets and a need for more functionality on the platform being tested. However, typically across the other satisfaction measures, the GIS scenarios score more highly, with higher task completion rates. This suggests that functionality does not necessarily equate to user satisfaction with the tools provided.
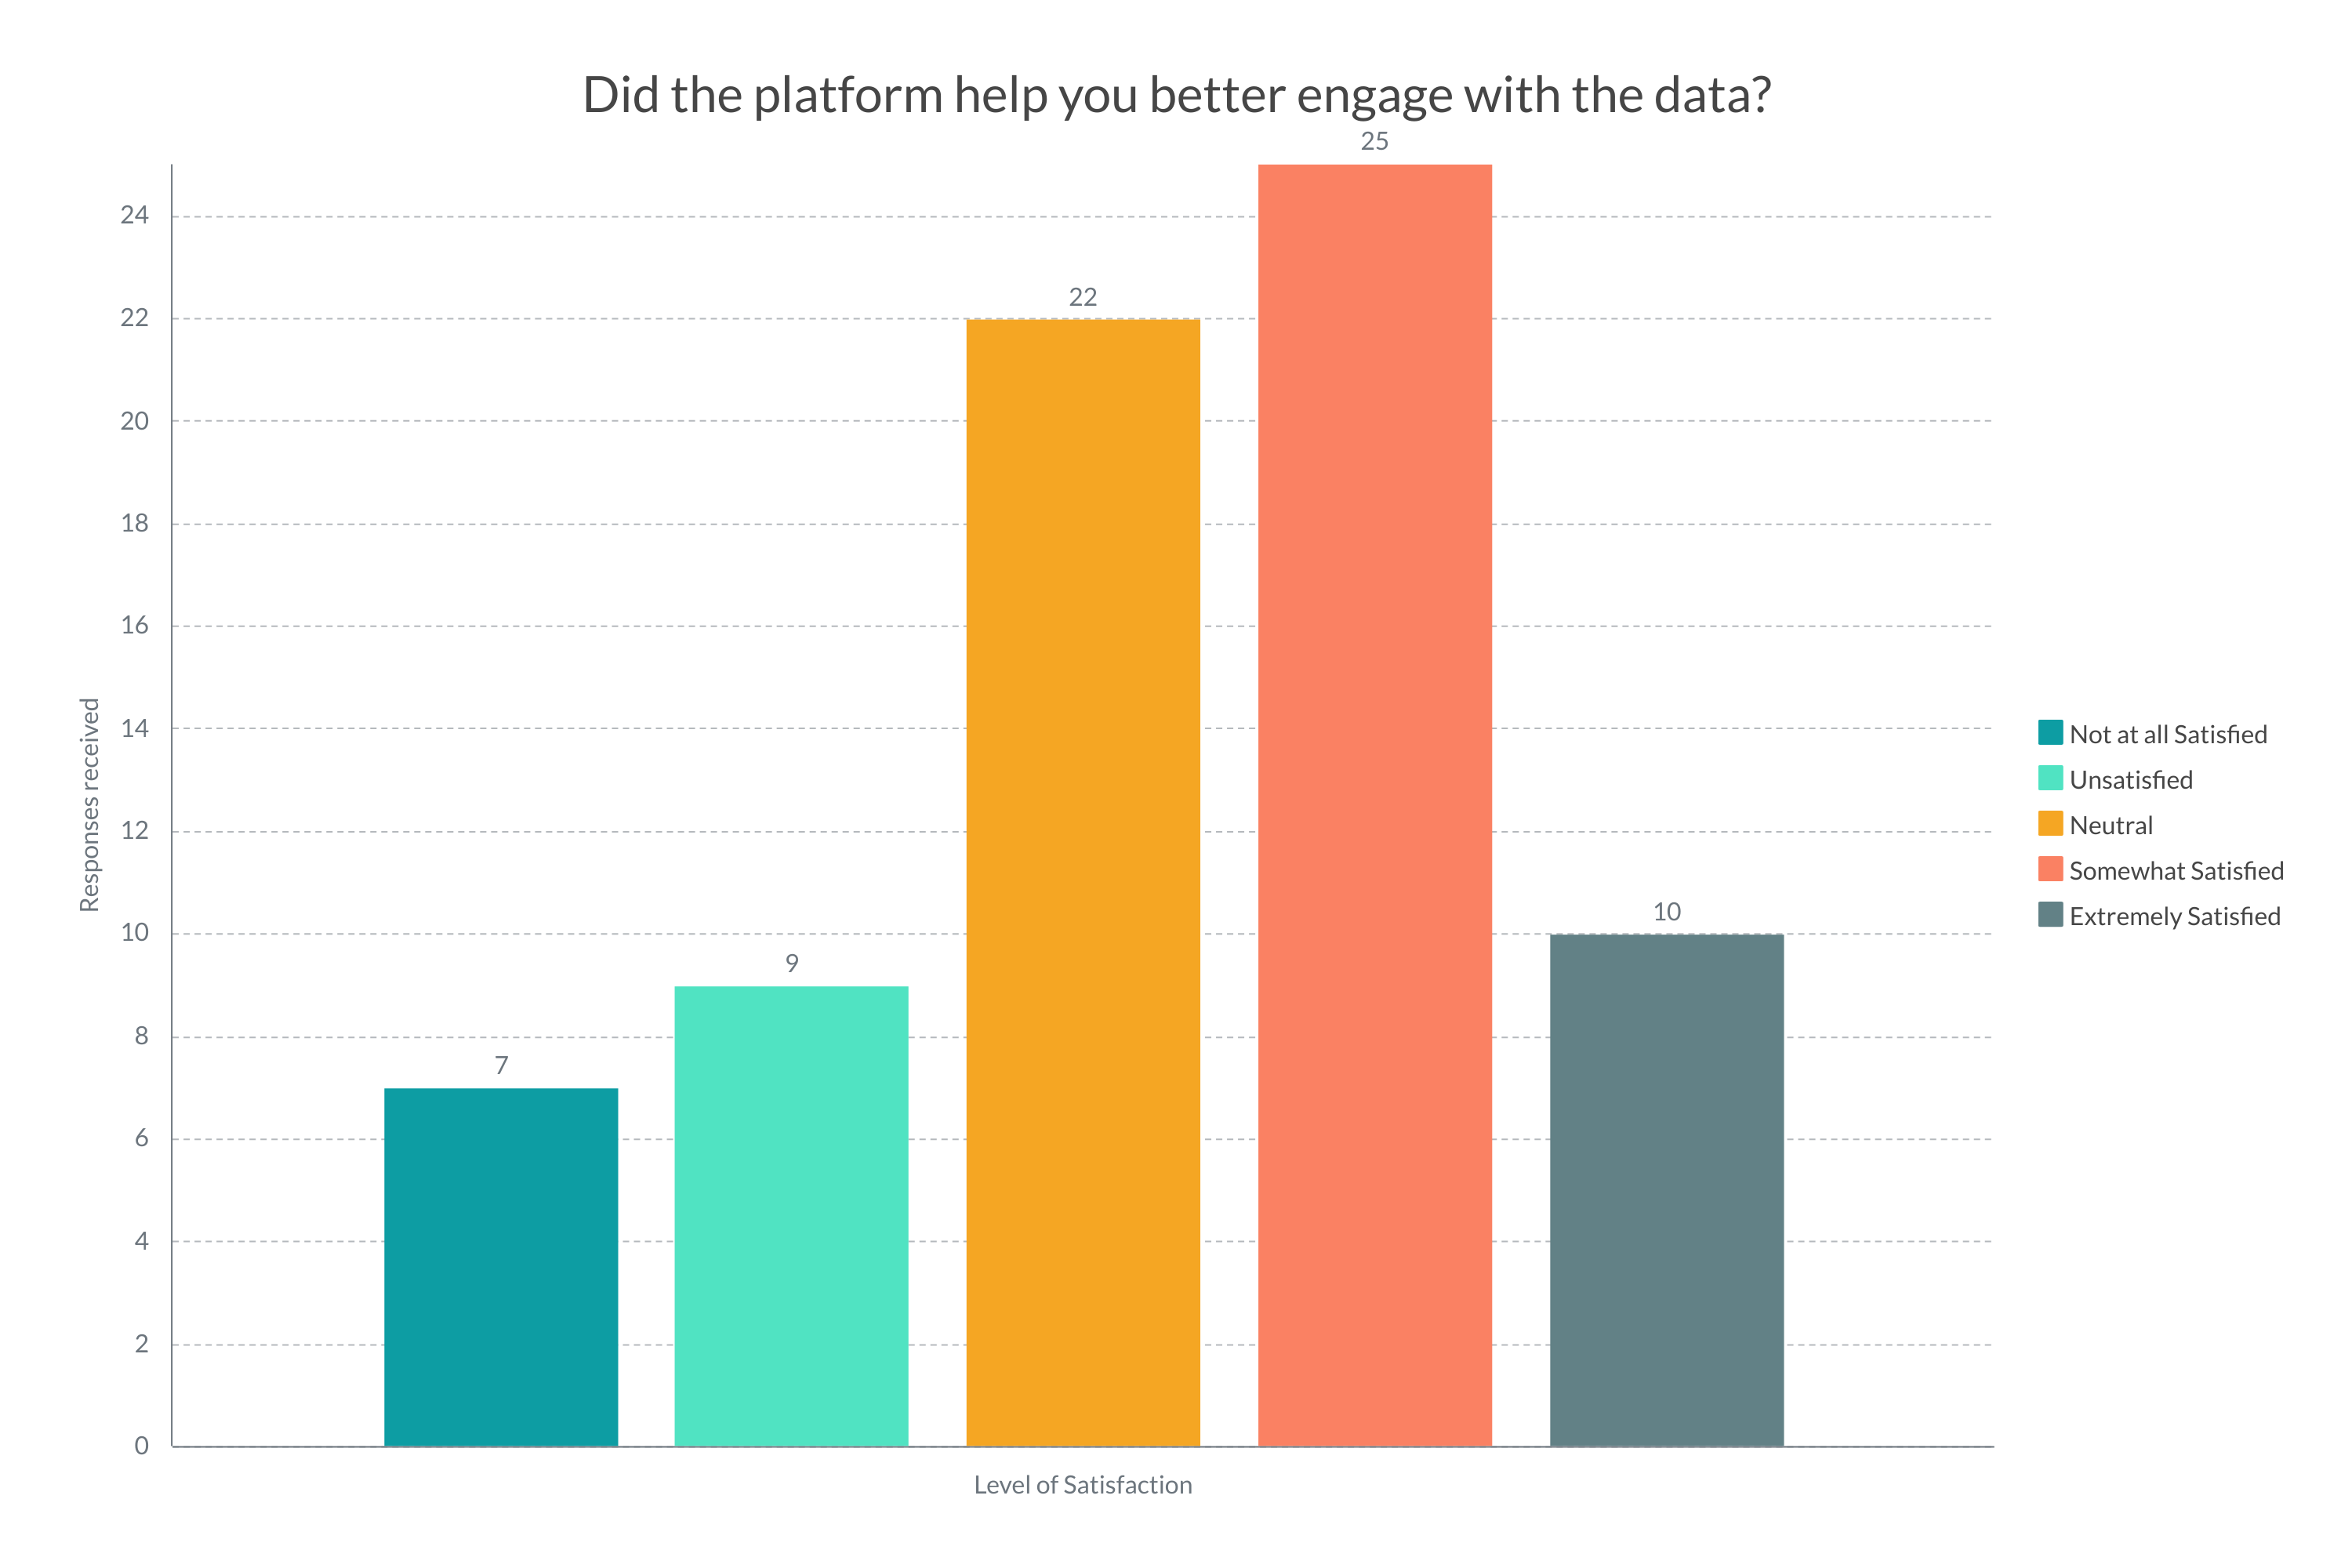
The response to this question was more positive than expected, with 53% (n=39) of respondents scoring highly (Fig.10). However, this question also had the highest dissatisfaction response, with 33% (n=24) of respondents scoring a one or two. Again, there was some variation, with the GIS #2 scenario having a positive response of 87% (n=14) and the 3D Pottery scenario having a negative response of 67% (n=10). The comments from respondents referred to the limited data quality for 3D models or, more generally, about a low quantity of available data. For users with higher satisfaction levels, comments related to search functionality that they found counterintuitive.
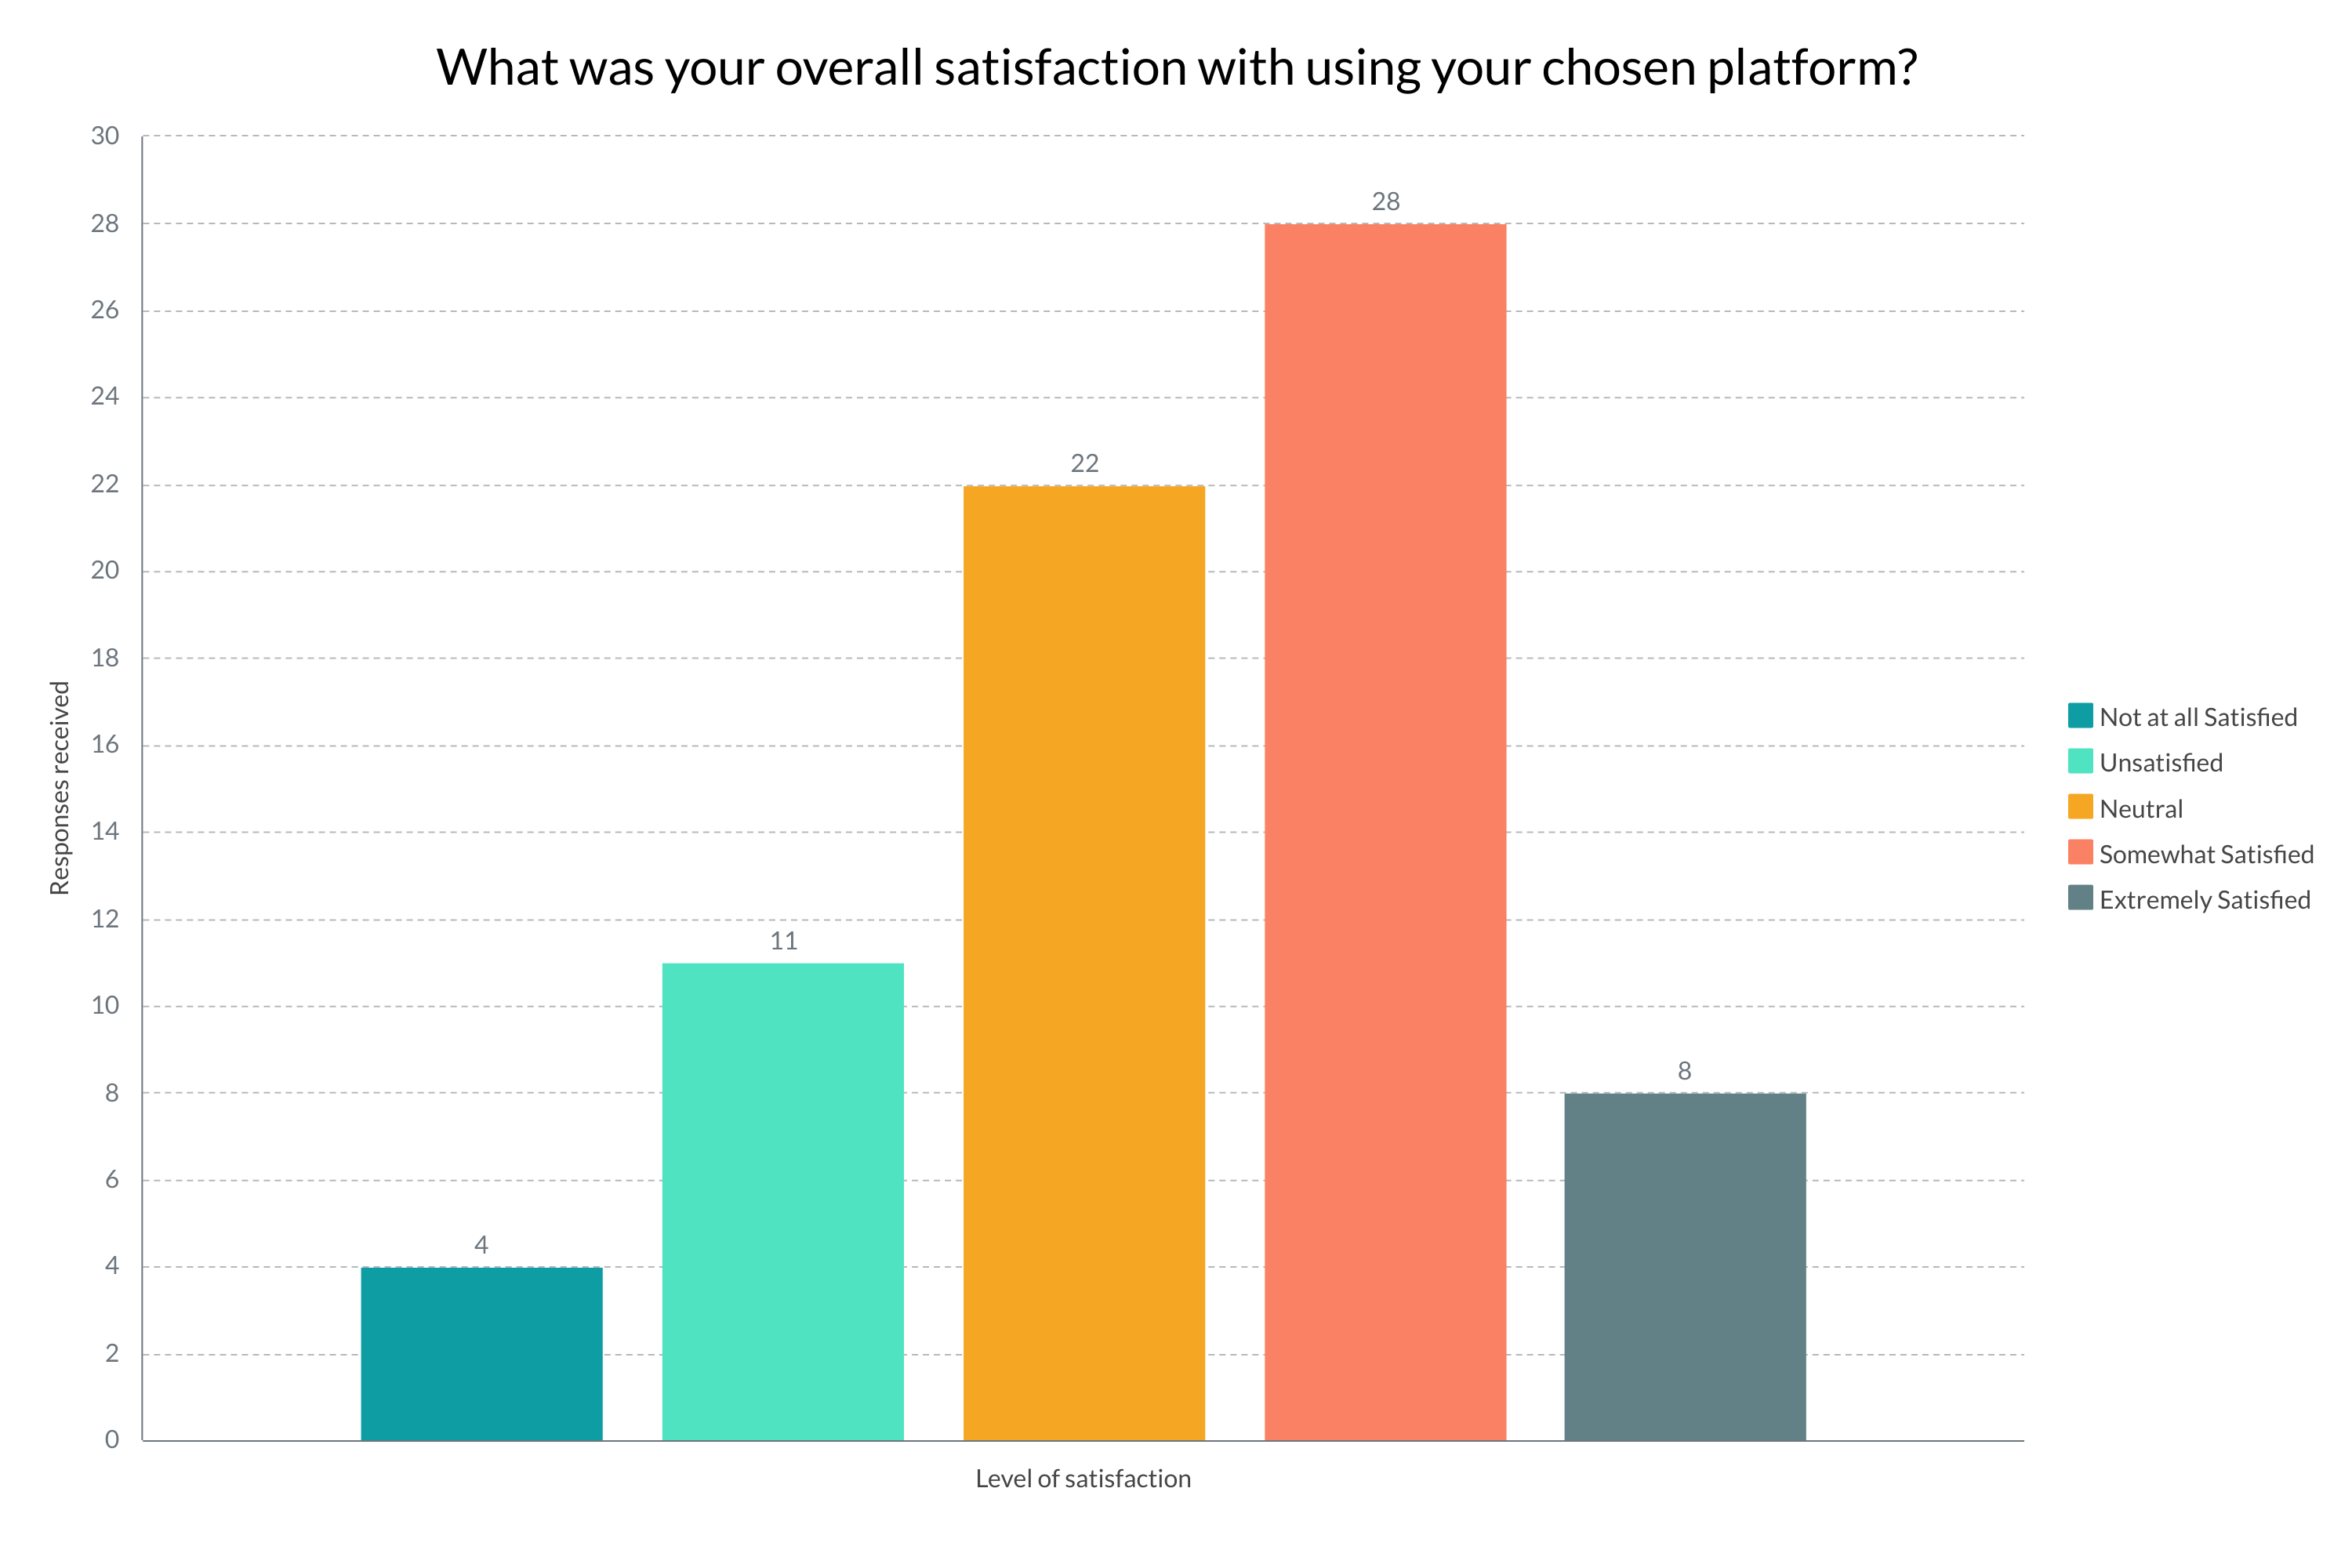
Overall, the response to this question proved neutral (Fig. 11). The exception was the GIS #3 scenario, with 50% (n=5) of its respondents scoring extremely satisfied. Only eight surveys were undertaken for this scenario, so it is not a significant representation. Two respondents scored two for all of the answers related to user satisfaction. In comparison, the remaining six respondents scored highly for the other categories, particularly for the previous data availability question. The same trend is not seen across the other scenarios.
The GIS scenarios scored highly for the final satisfaction question, while the other scenarios were more neutral (Fig. 12). These scores suggest that some data reusers are satisfied with the tools available and can find the relevant data, while others are unsatisfied.
We expected that our user community would be unhappy with the tools available. Instead, the comments suggest that the user community is more confused than unsatisfied. However, the confusion may be a by-product of the survey design. Feedback received at the 2022 workshop pointed out the confusion expressed in the survey and the inability to relate to the scenarios chosen to test the data found on the platforms tested.
Like satisfaction, respondents were asked to answer questions on trust using a Likert scale where one is 'Not at all Confident' and five is 'Extremely Confident'. The questions on trust were compulsory, but the comments were optional and provided as a single text box. The original questions were divided into three categories: trust in the system, trust in the data and trust in the metadata. The questions were worded and reworded several times to ensure they addressed what we needed to know. The expectation was that trust scores would be low. However, trust was generally rated more positively compared with the previous satisfaction scores.
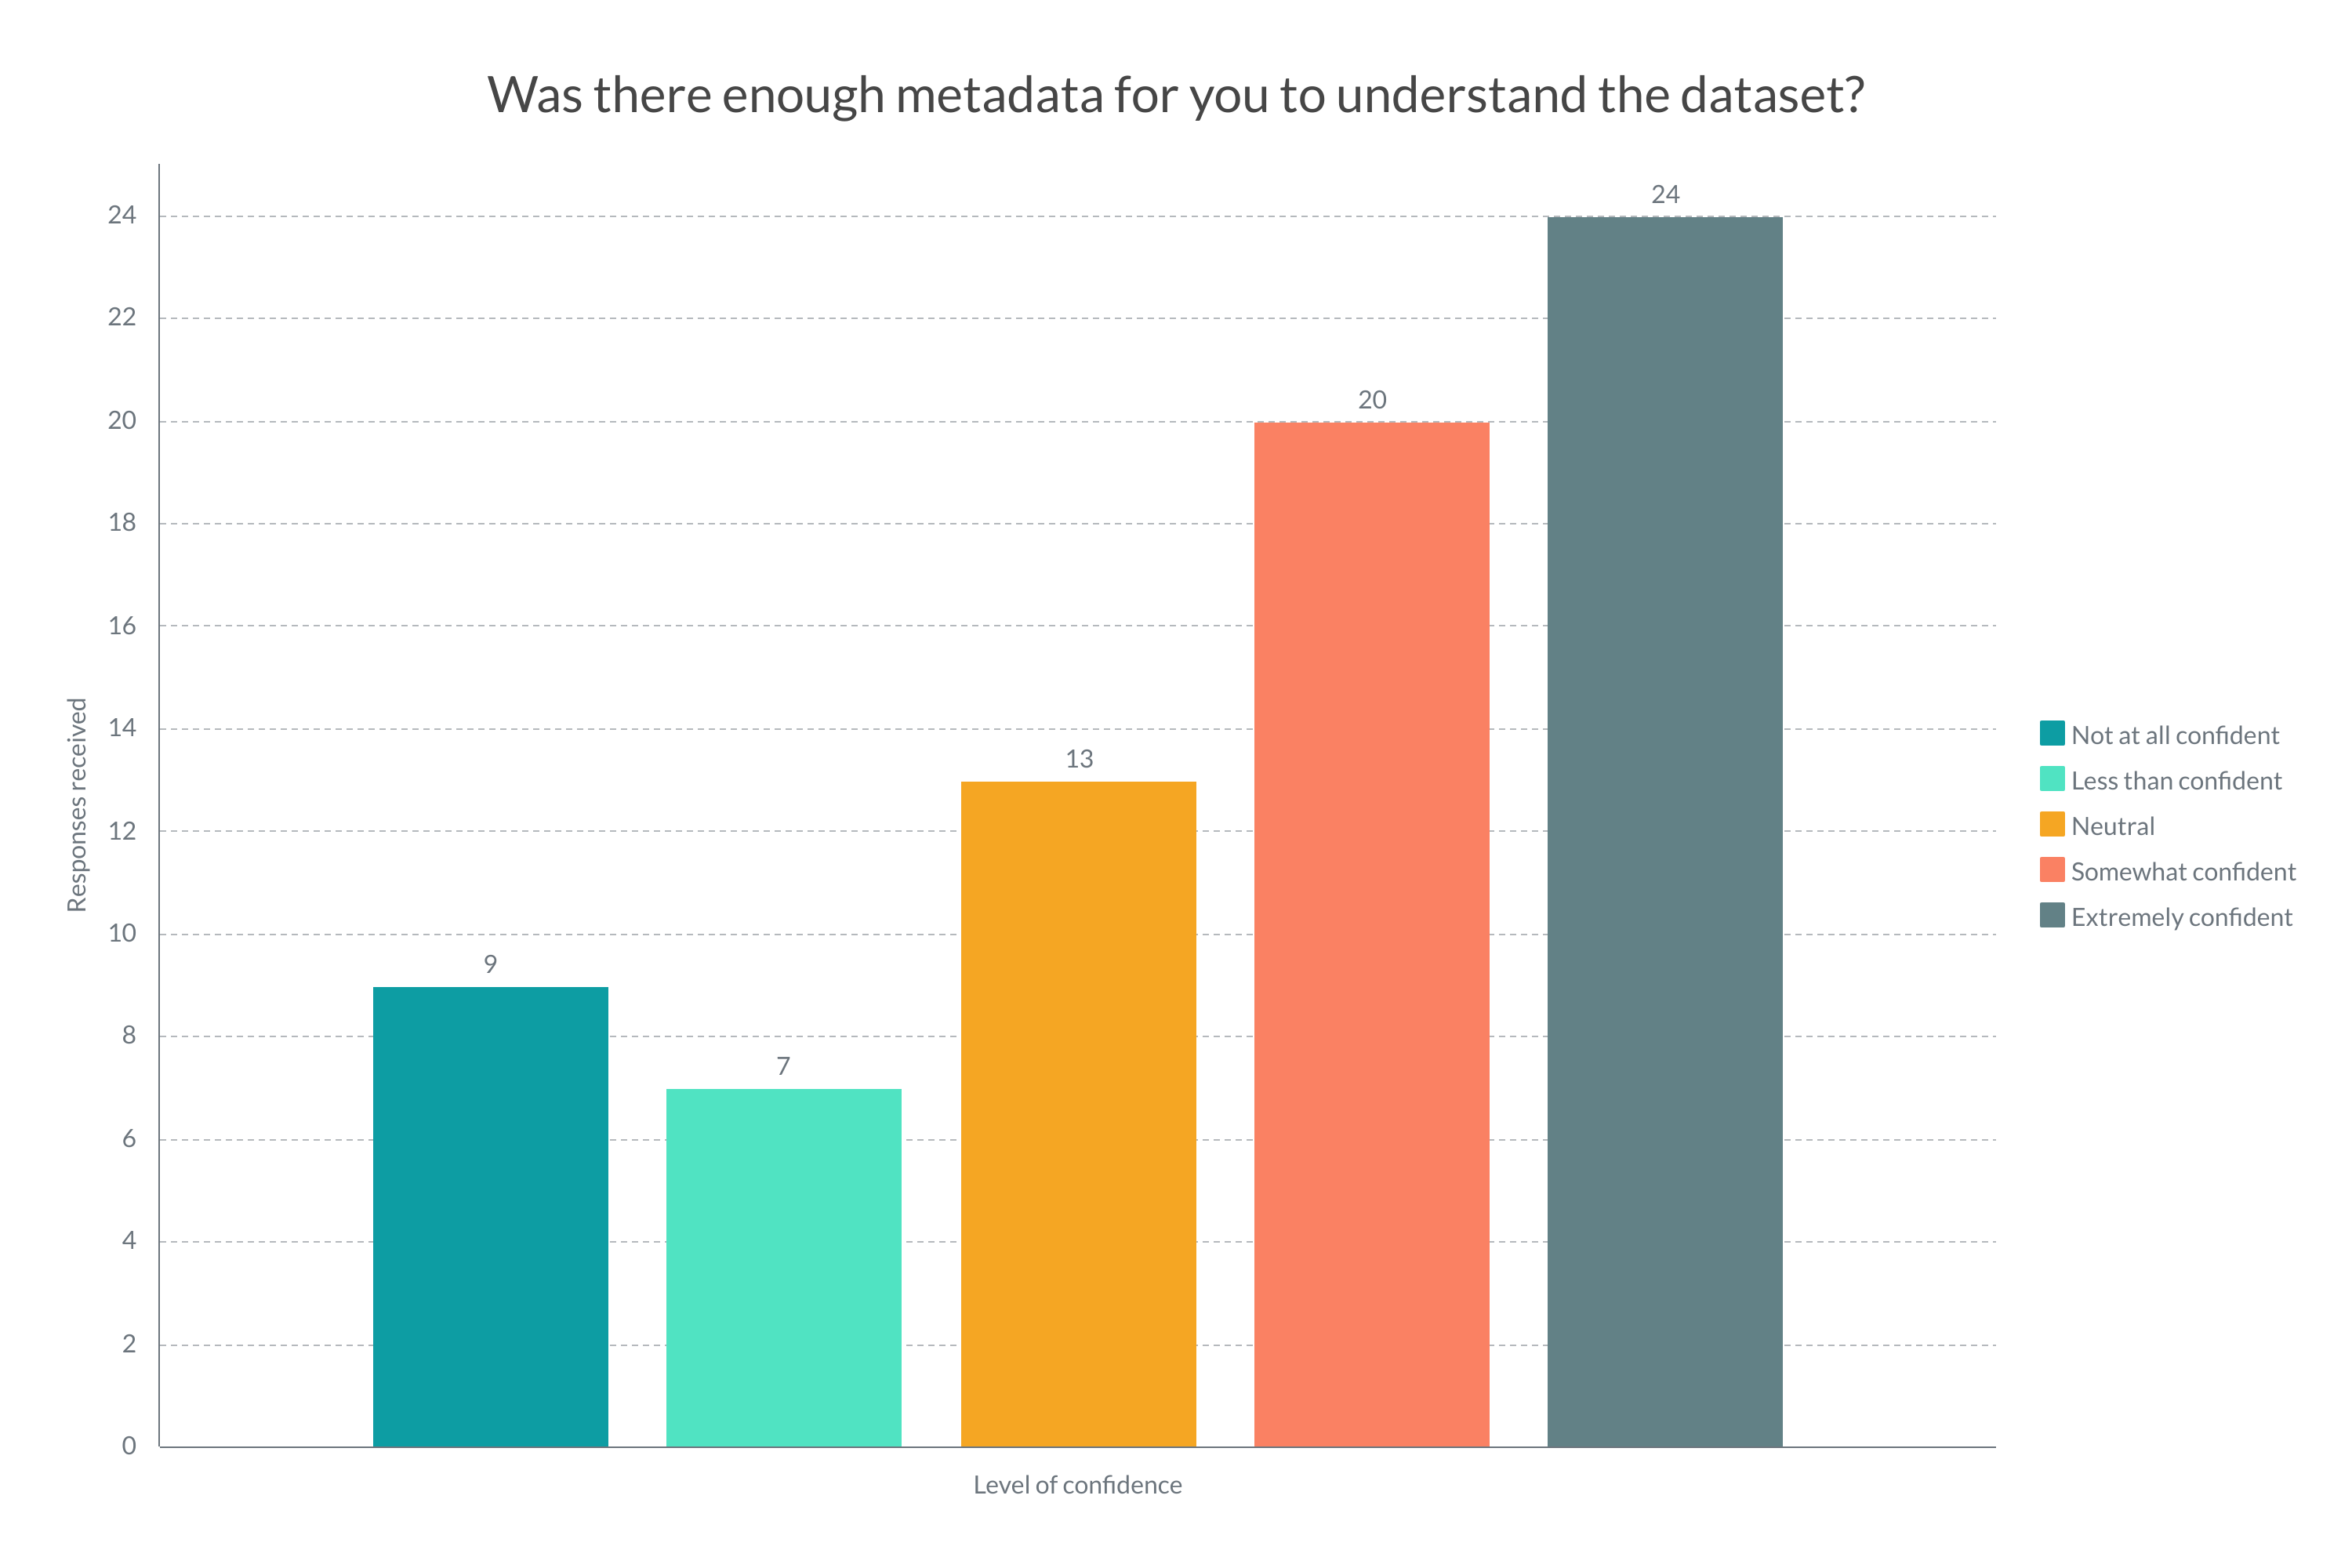
For the first question on trust, 60% (n=44) of respondents were somewhat confident or extremely confident (Fig. 13). The scores varied, with 38% (n=3) of GIS #3 responses scored not at all confident, while 91% (n=10) of Radiocarbon respondents scored somewhat or extremely confident (see Table 4 for a comparison of scenarios). Respondents who gave a low score commented that they could not locate any metadata or that familiarity with the data was required to make sense of it. Respondents who scored low for this question also had a similar score for the other questions, with eight respondents scoring a one across all three questions.
| Scenario | Not at all confident | Less than confident | Neutral | Confident | Extremely confident |
|---|---|---|---|---|---|
| GIS #1 | 3 | 2 | 2 | 4 | 10 |
| GIS #2 | 1 | 3 | 3 | 3 | 6 |
| GIS #3 | 3 | 0 | 1 | 1 | 3 |
| 3D Pottery #1 | 1 | 2 | 7 | 2 | 3 |
| 3D Pottery #2 | 0 | 0 | 0 | 2 | 0 |
| C14 | 1 | 0 | 0 | 8 | 2 | Overall Response | 12.3% | 9.6% | 17.8% | 27.4% | 32.9% |
| Scenario | Not at all confident | Less than confident | Neutral | Confident | Extremely confident |
|---|---|---|---|---|---|
| GIS #1 | 3 | 2 | 4 | 4 | 8 |
| GIS #2 | 1 | 2 | 4 | 3 | 6 |
| GIS #3 | 2 | 1 | 2 | 2 | 1 |
| 3D Pottery #1 | 4 | 3 | 5 | 2 | 1 |
| 3D Pottery #2 | 0 | 0 | 0 | 2 | 0 |
| C14 | 1 | 3 | 2 | 4 | 1 | Overall Response | 15.1% | 15.1% | 23.3% | 23.2% | 23.3% |
| Scenario | Not at all confident | Less than confident | Neutral | Confident | Extremely confident |
|---|---|---|---|---|---|
| GIS #1 | 3 | 2 | 3 | 4 | 9 |
| GIS #2 | 1 | 1 | 3 | 6 | 5 |
| GIS #3 | 3 | 0 | 1 | 0 | 4 |
| 3D Pottery #1 | 3 | 3 | 3 | 4 | 2 |
| 3D Pottery #2 | 0 | 0 | 0 | 1 | 1 |
| C14 | 2 | 3 | 0 | 5 | 1 | Overall Response | 16.4% | 8.2% | 17.8% | 27.4% | 30.1% |
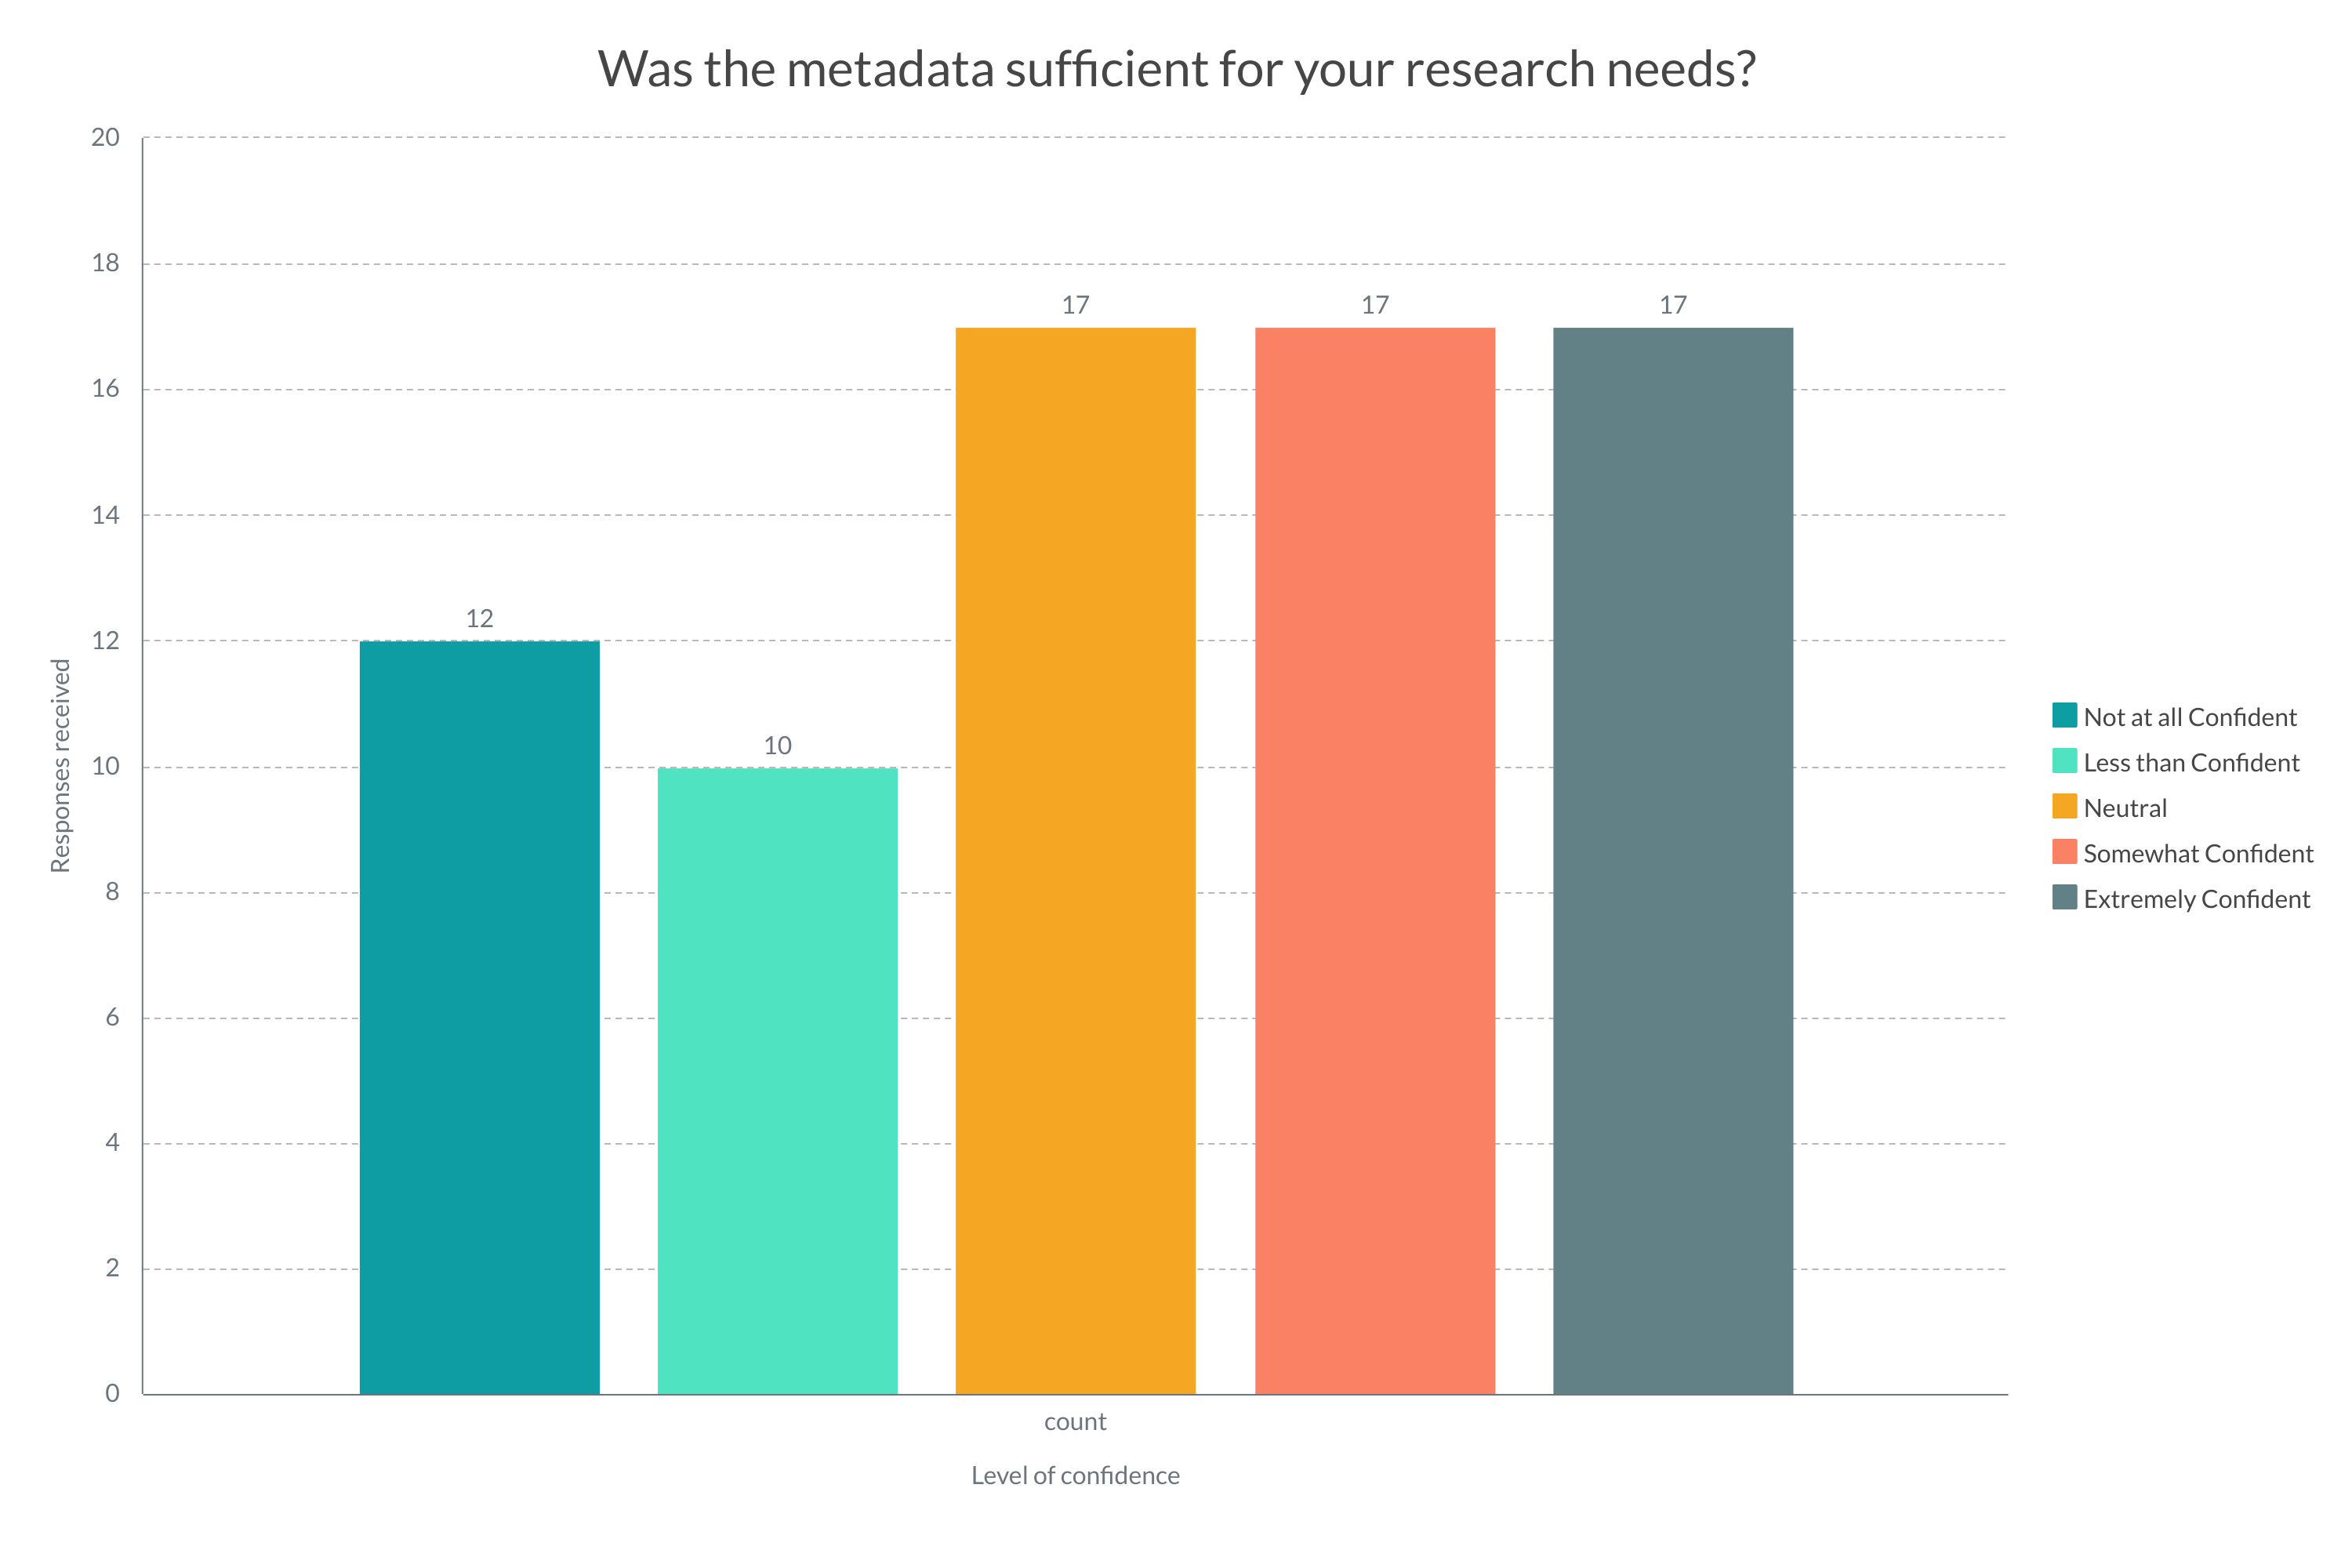
The second question scored somewhat evenly (Fig. 14). For each category between neutral and extremely confident, there were 17 responses recorded. Again, there was some variation between the scenarios, with the GIS scenarios scoring more positively and the 3D and Radiocarbon scenarios scoring neutrally. The 3D Pottery #1 scenario had a response rate of 27% (n=4) for not at all confident.
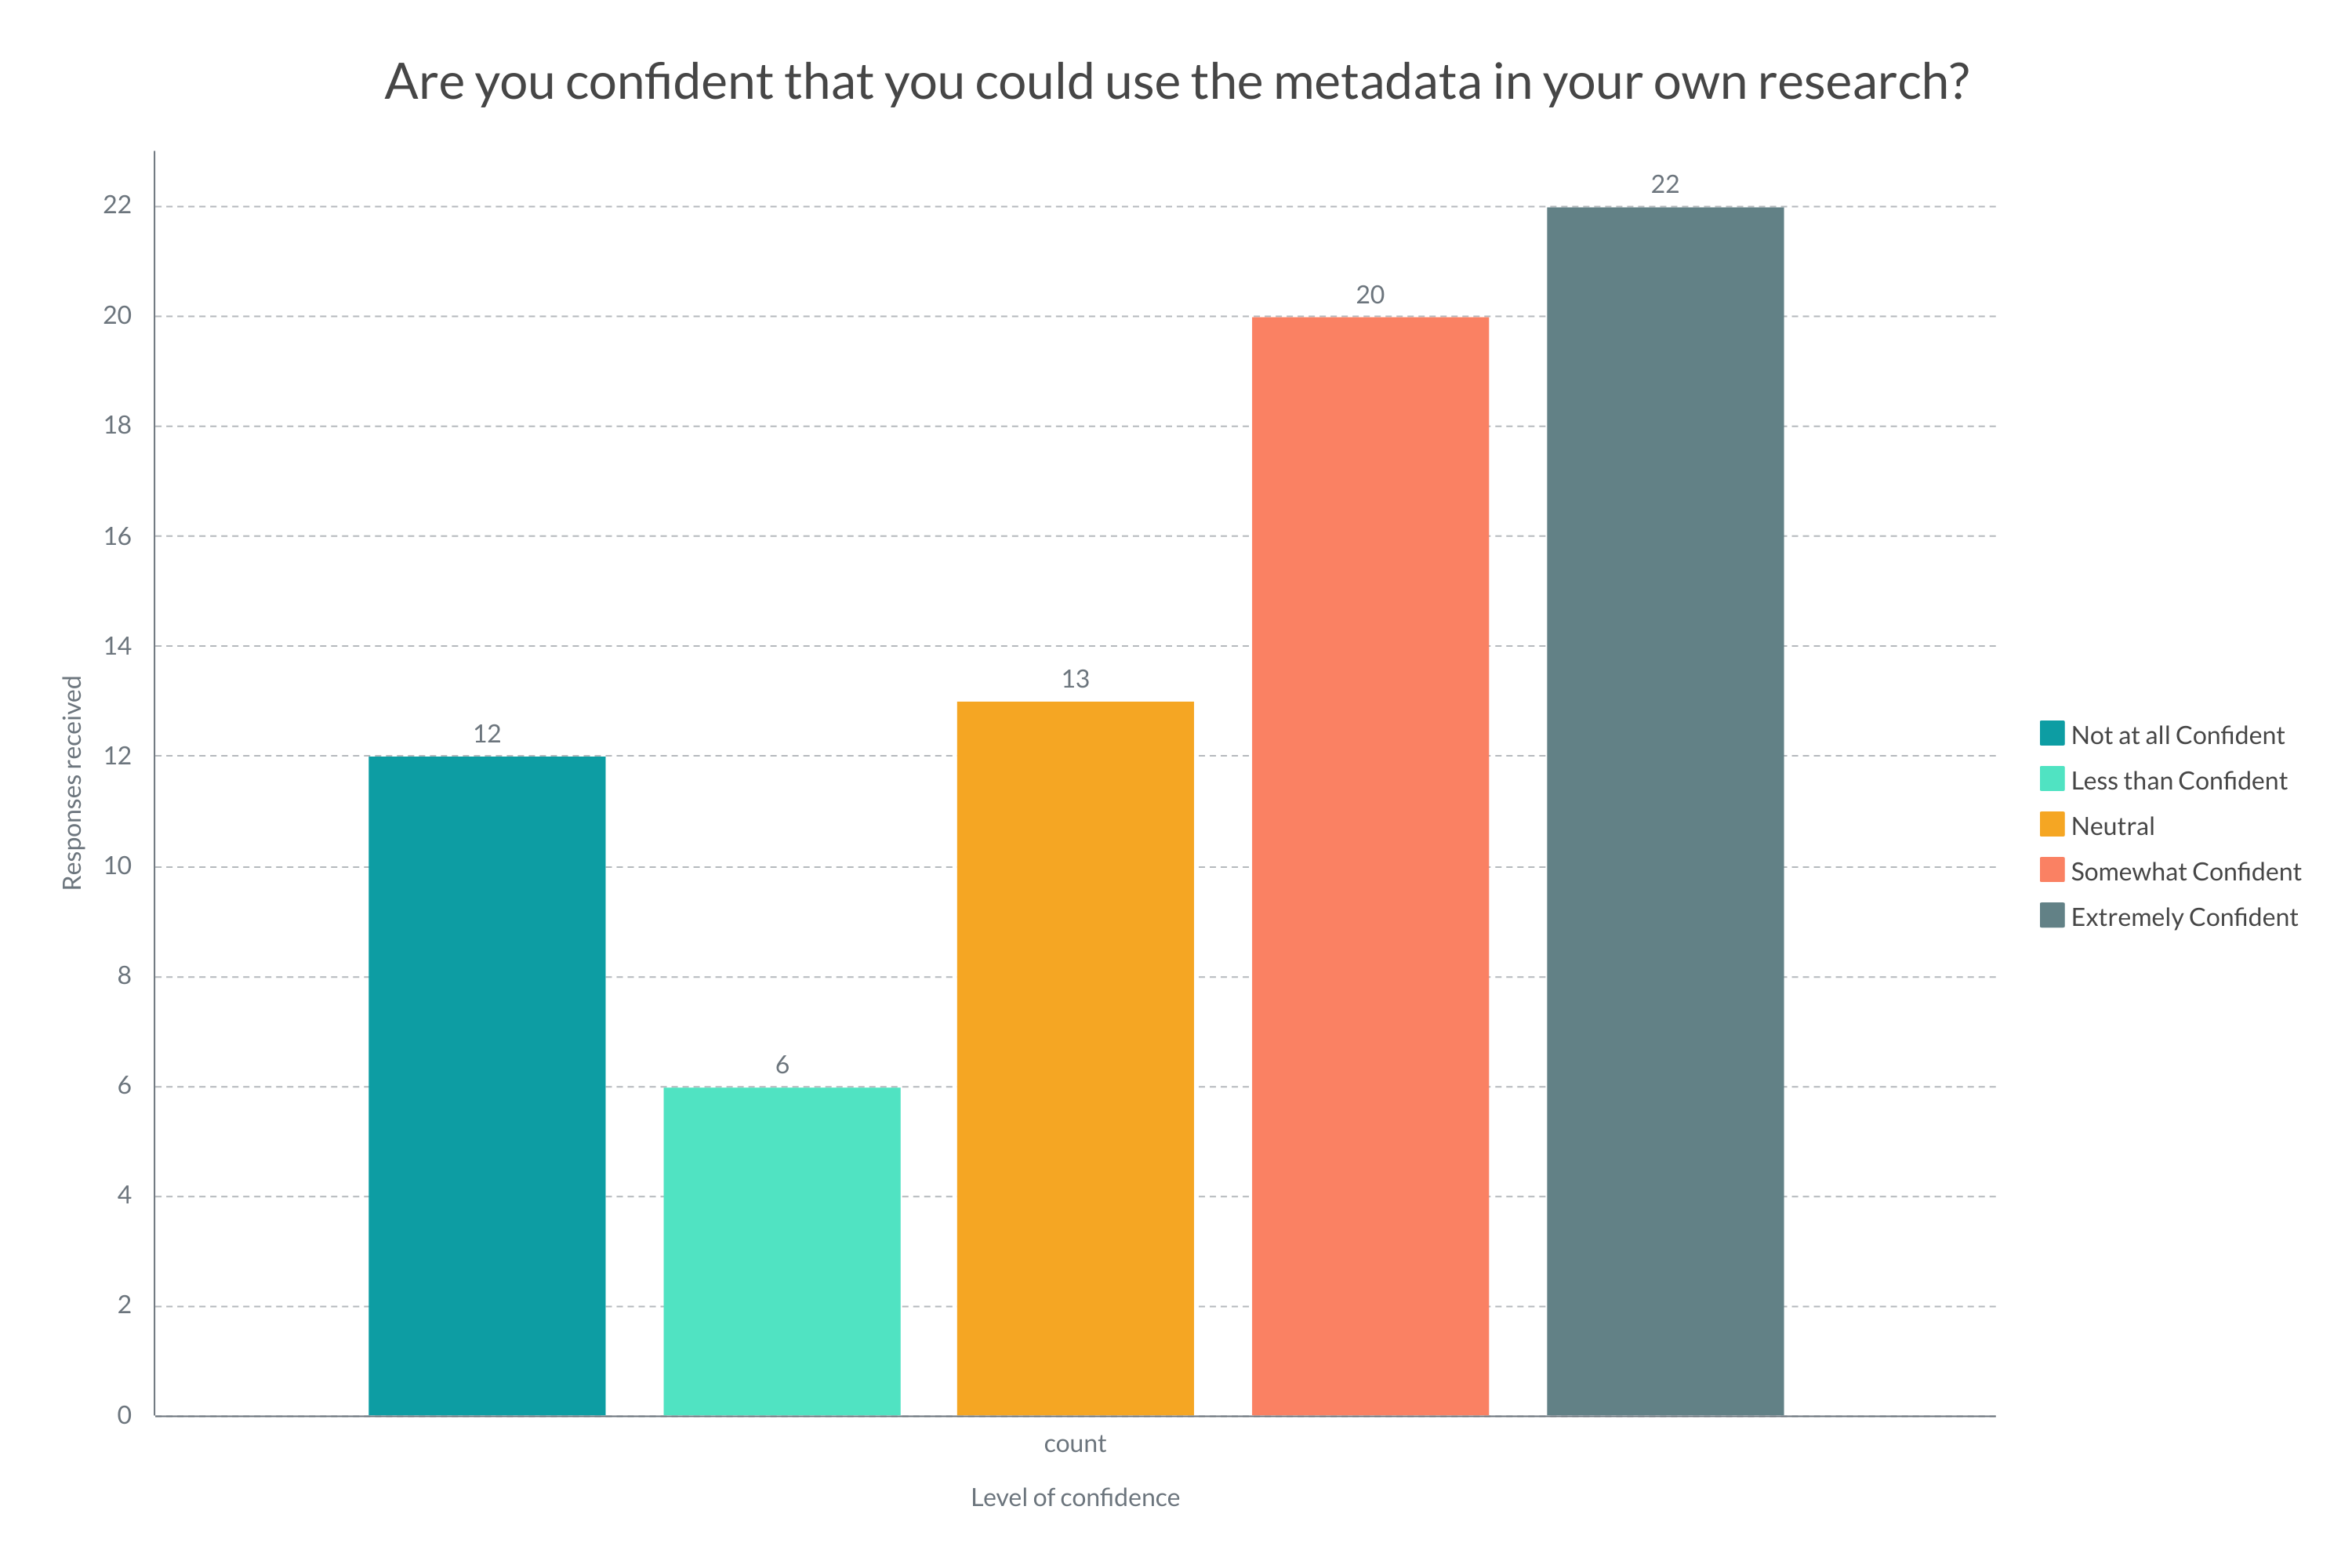
The final measure for trust tended to have a more positive response than the previous two questions (Fig. 15). The response for the GIS scenario is interesting, with 50% (n=4) of responses scoring extremely confident and 38% (n=3) scoring not confident at all. Contrasted with the previous result, fewer GIS #3 respondents thought that there was not enough metadata for their needs, yet they would still be willing to use the dataset. The scores were evenly spread for the 3D Pottery scenario, although there appears to be a slight increase in confidence compared to the previous question.
Context coverage is the evaluation measure that assesses the overall usability of software in the ISO 25022 standard. For the survey, the data collected addressing context was qualitative, with text boxes asking questions about satisfaction and trust. The first question asked respondents about their operating systems and internet browsers. Primarily the operating system was Microsoft Windows, and the primary browser was Google Chrome. This question was asked to determine if the software used to access platforms impacted the user experience. However, these data were not used further in this analysis.
The following three questions asked the user about the flexibility of the data and their personal preferences. Half of the respondents said yes when asked if they could export the data for use on another platform (Fig. 16).
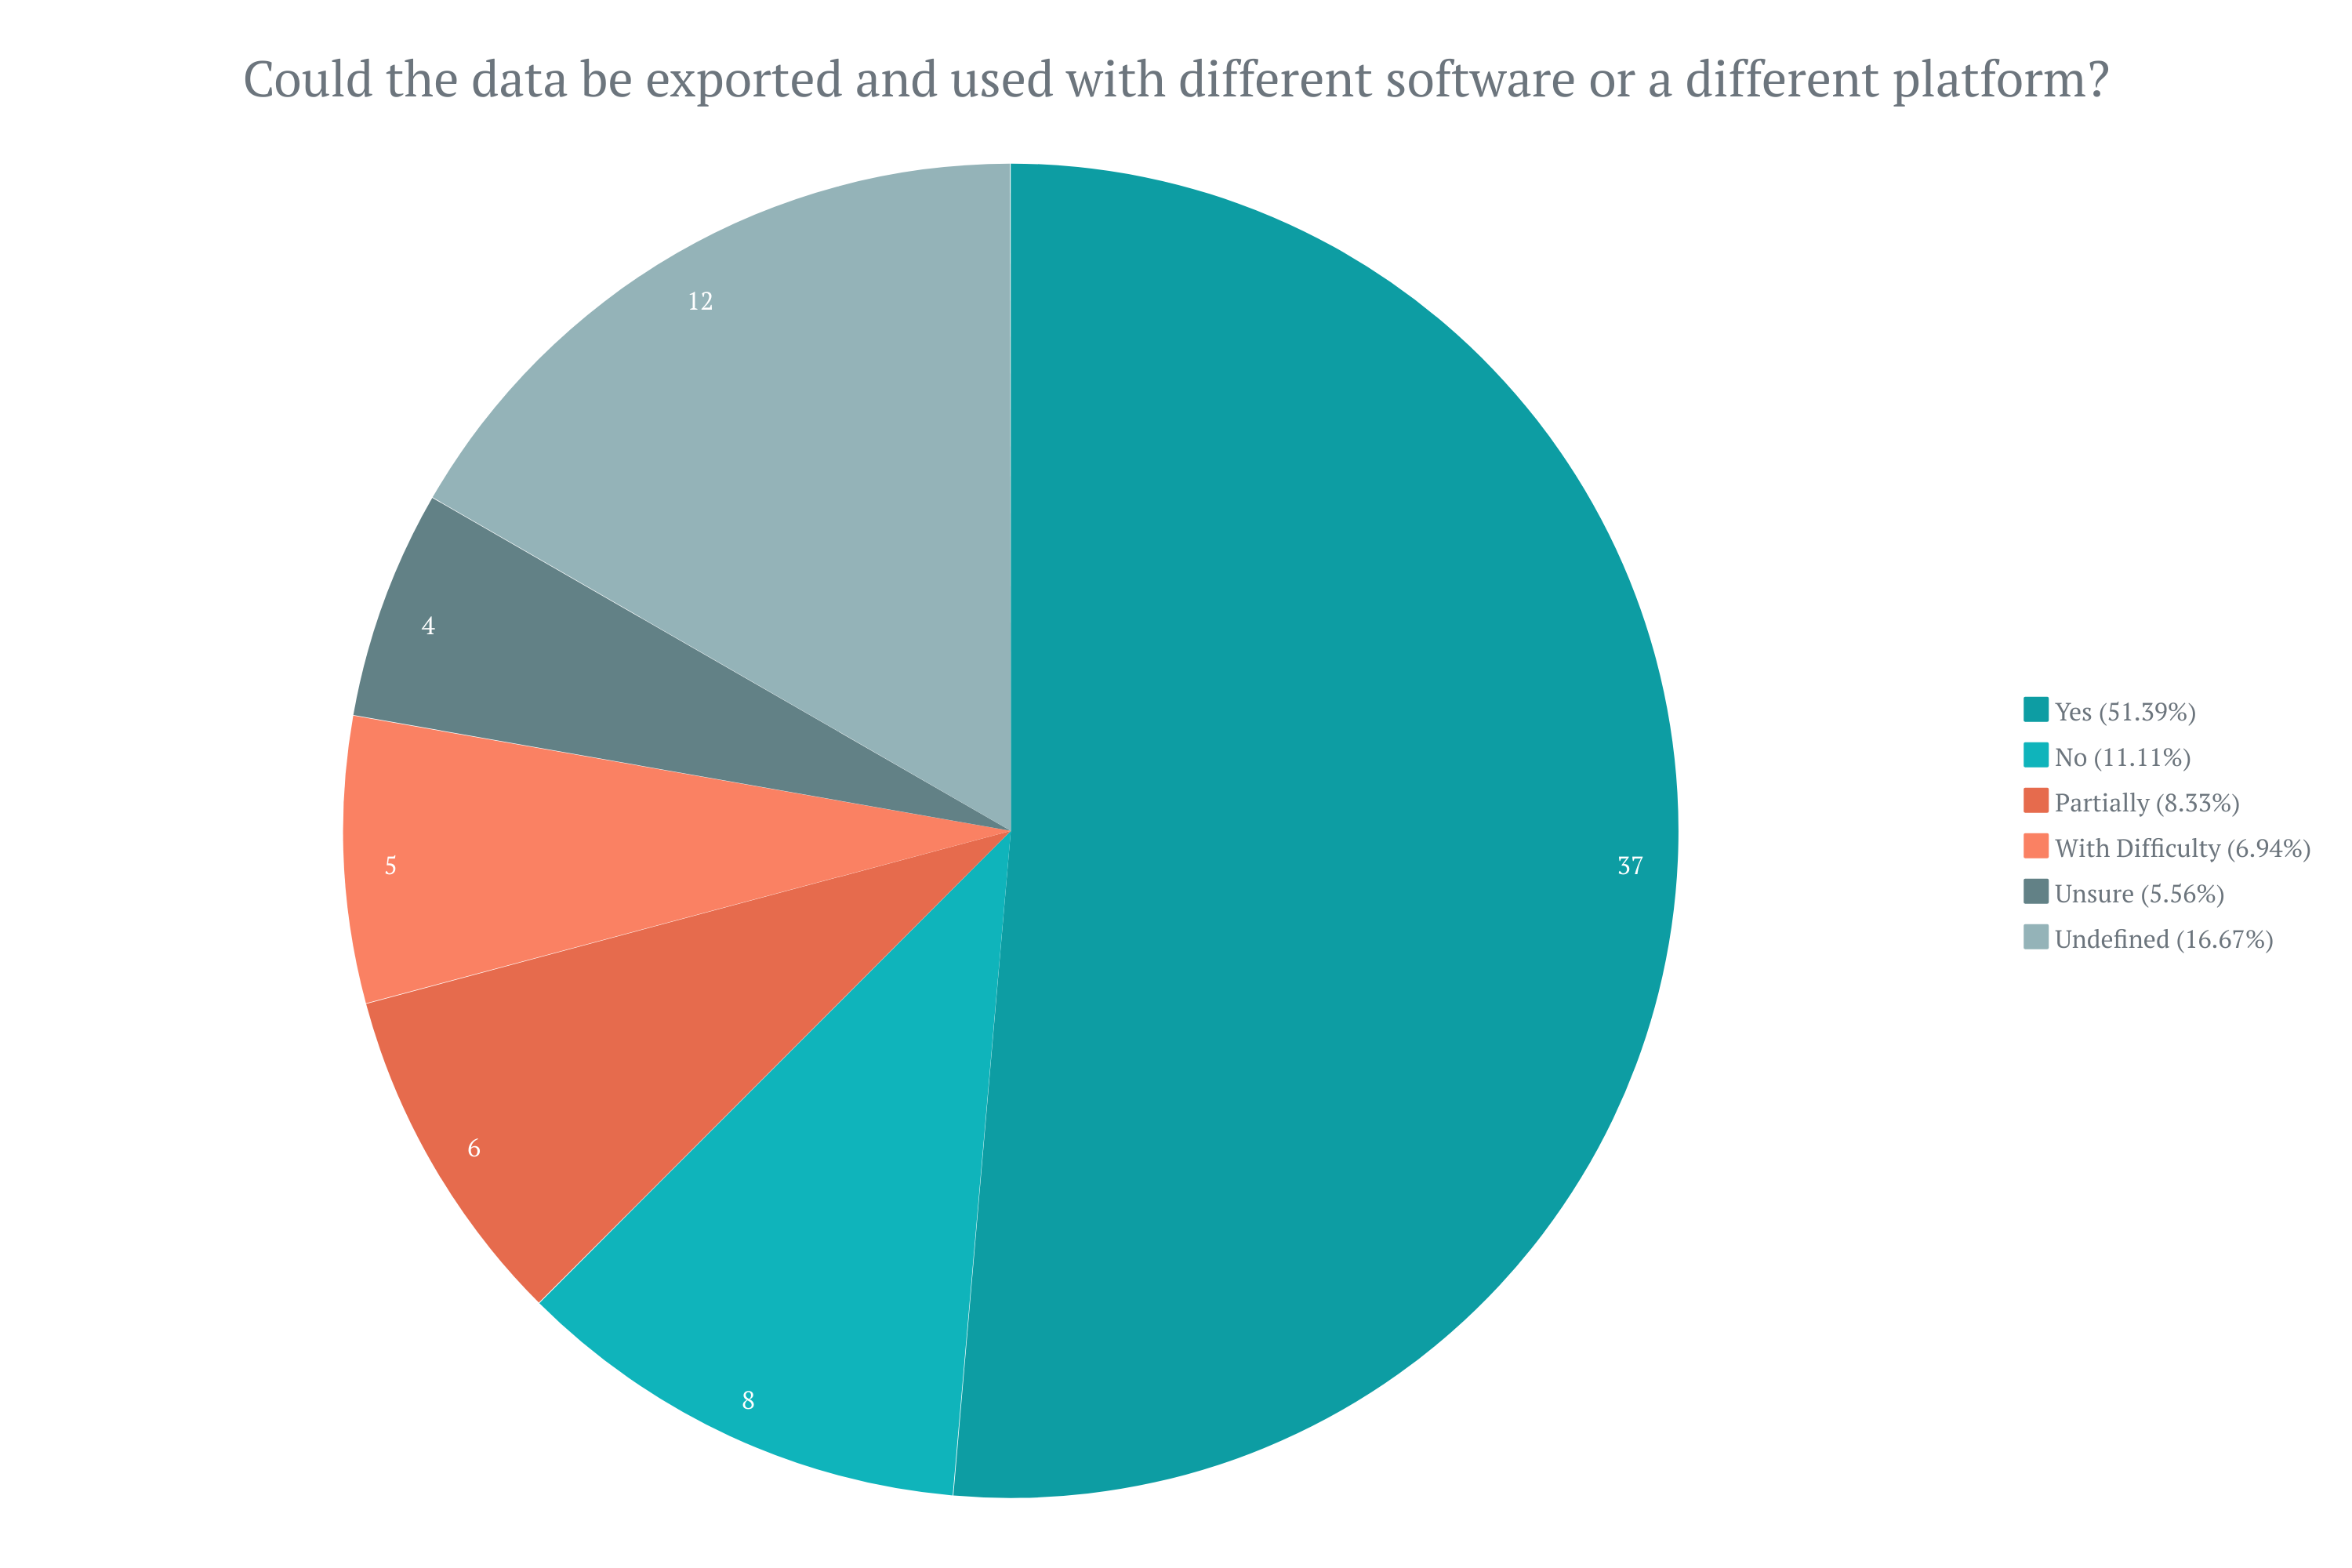
Some respondents gave one or two-word responses, while others provided additional detail. For example, one respondent commented that the data could not be exported but could be copied and pasted in a tabular format. Comments also included an objection to registering to view data. The next question asked if the exportable format was their preferred option (Fig. 17).
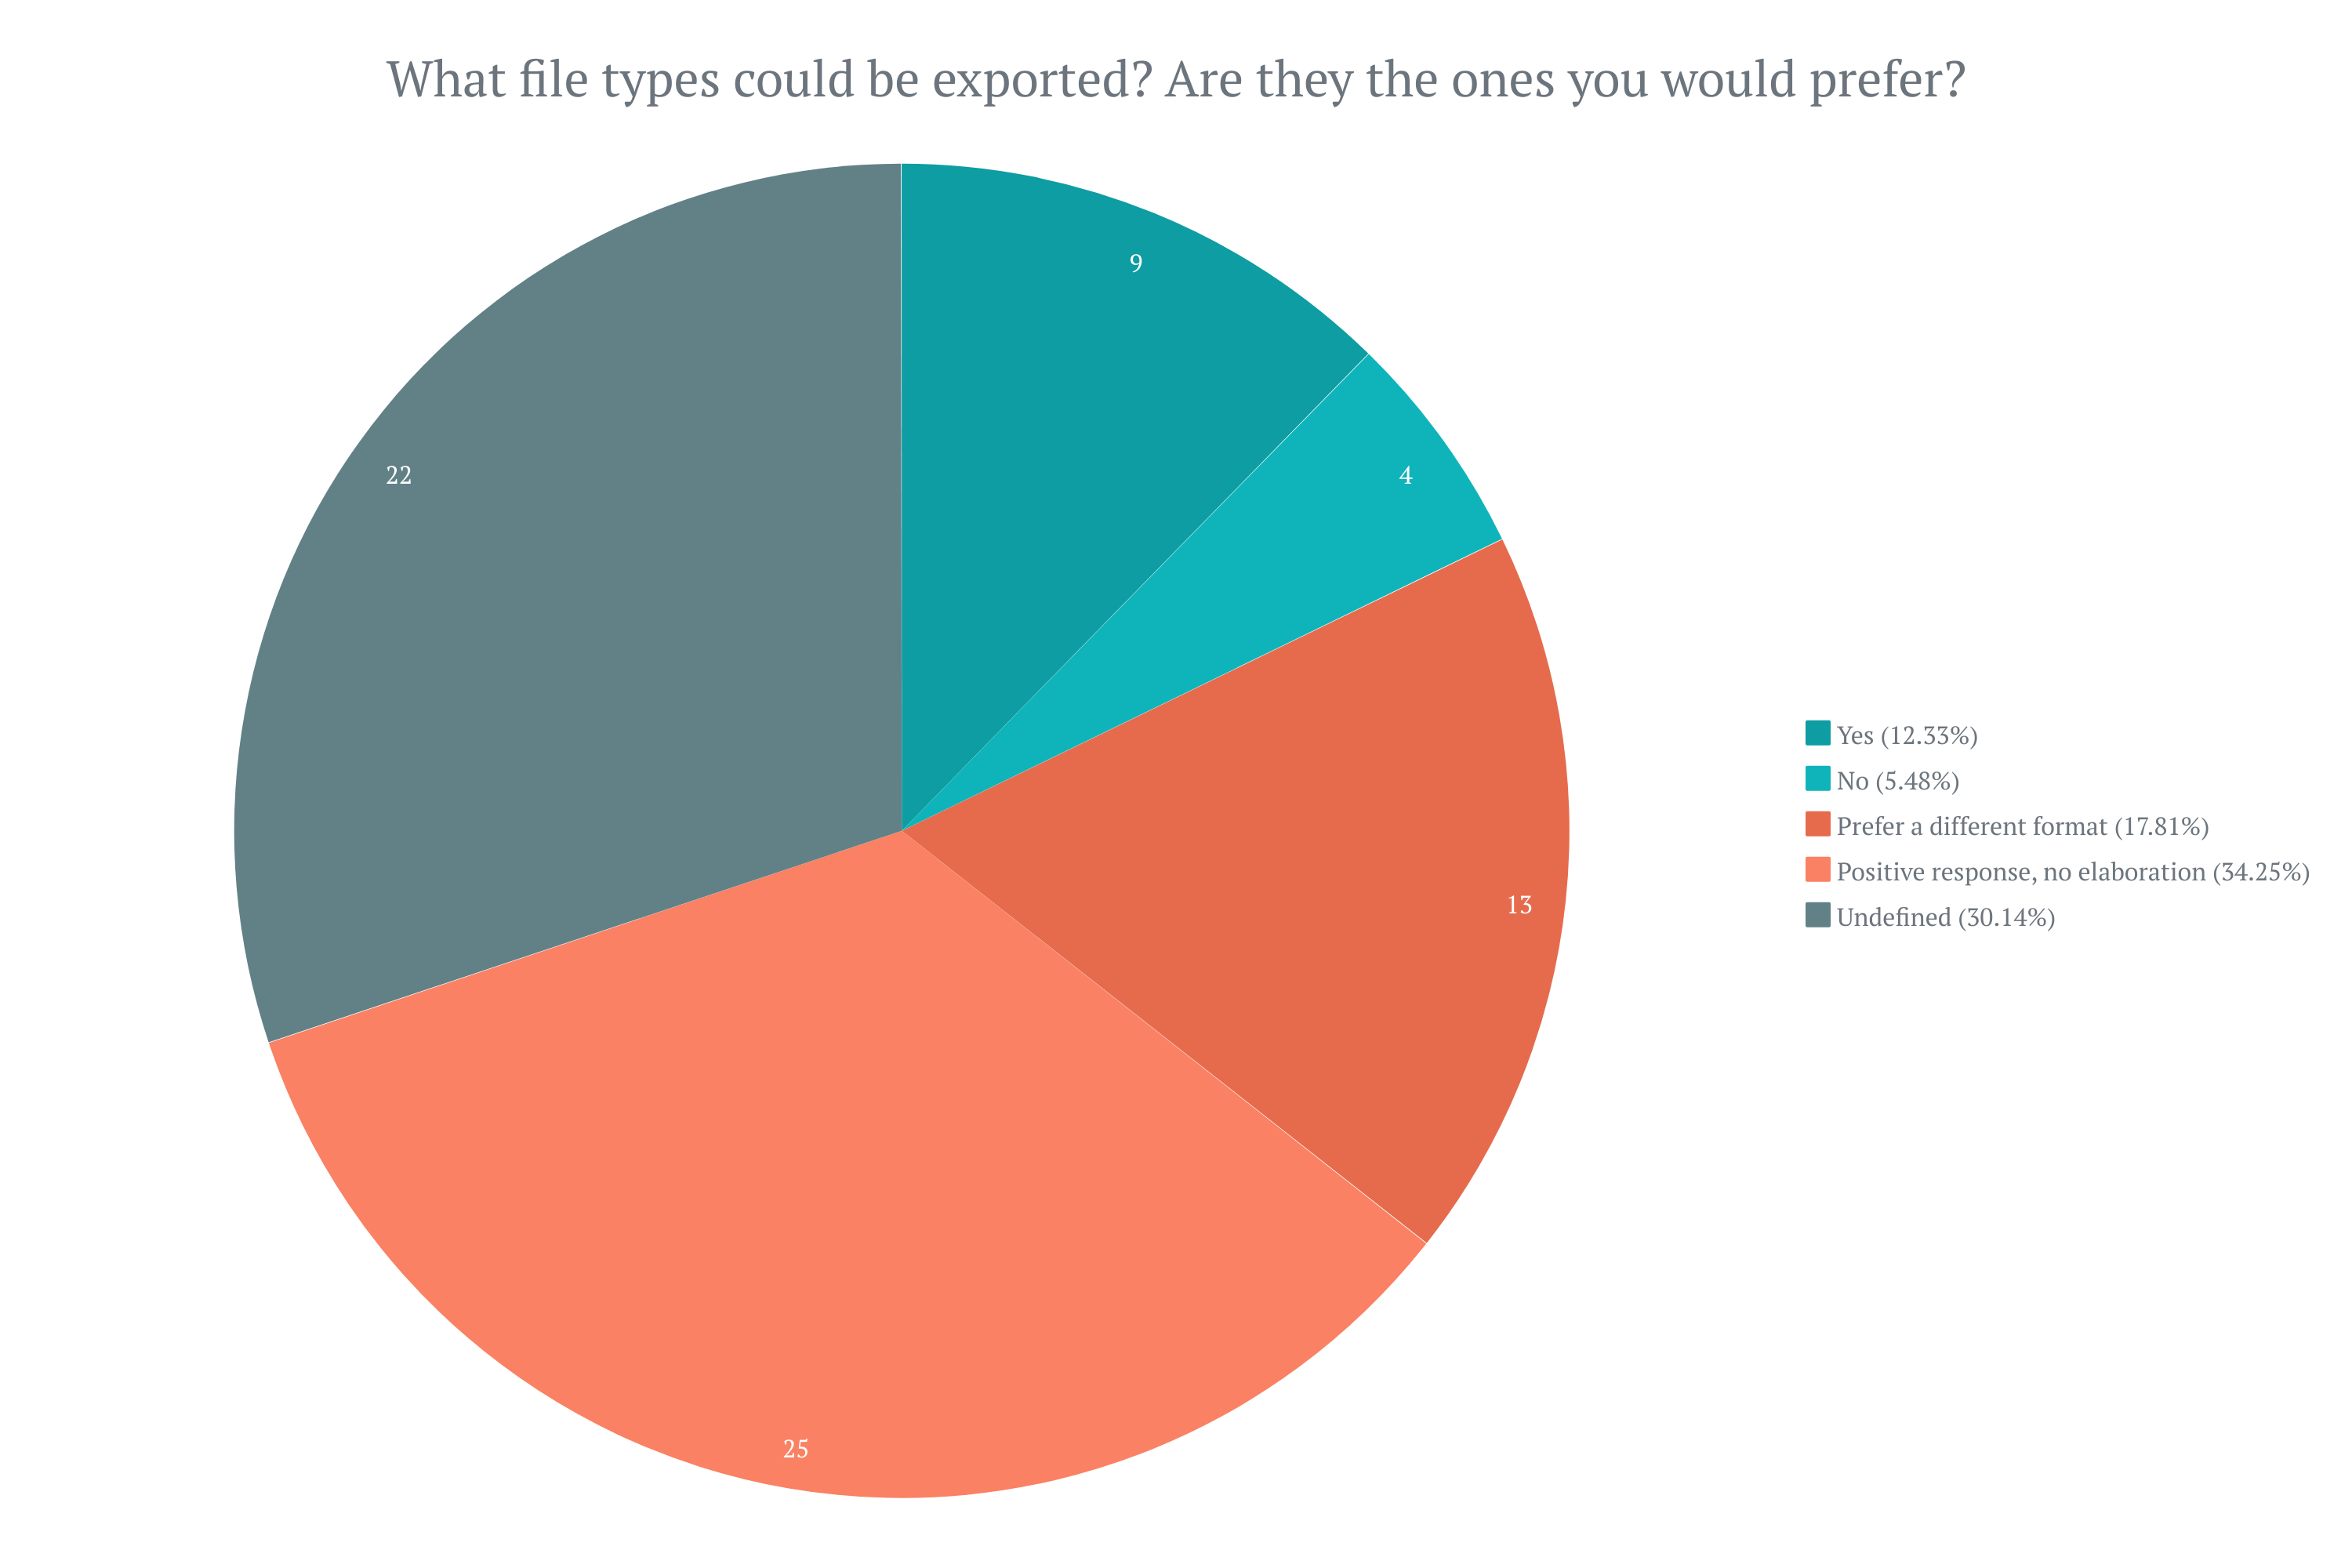
For this question, 12% (n=9) of respondents said emphatically yes, while 30% (n=22) responded positively but did not confirm. For example, 'Most of them are in OBJ, which is a common solution'. The final question for this section asked how flexible the data were or whether further modification was required before it could be used. The responses to this question were mixed, with 36% (n=26) of respondents saying yes. The remaining responses either answered negatively or gave no response at all. As one respondent pointed out, the response to this question depended on the research question.
The following two questions focused on available documentation from the data platform. First, the respondent was asked to comment on the availability of licensing information (Fig. 18).
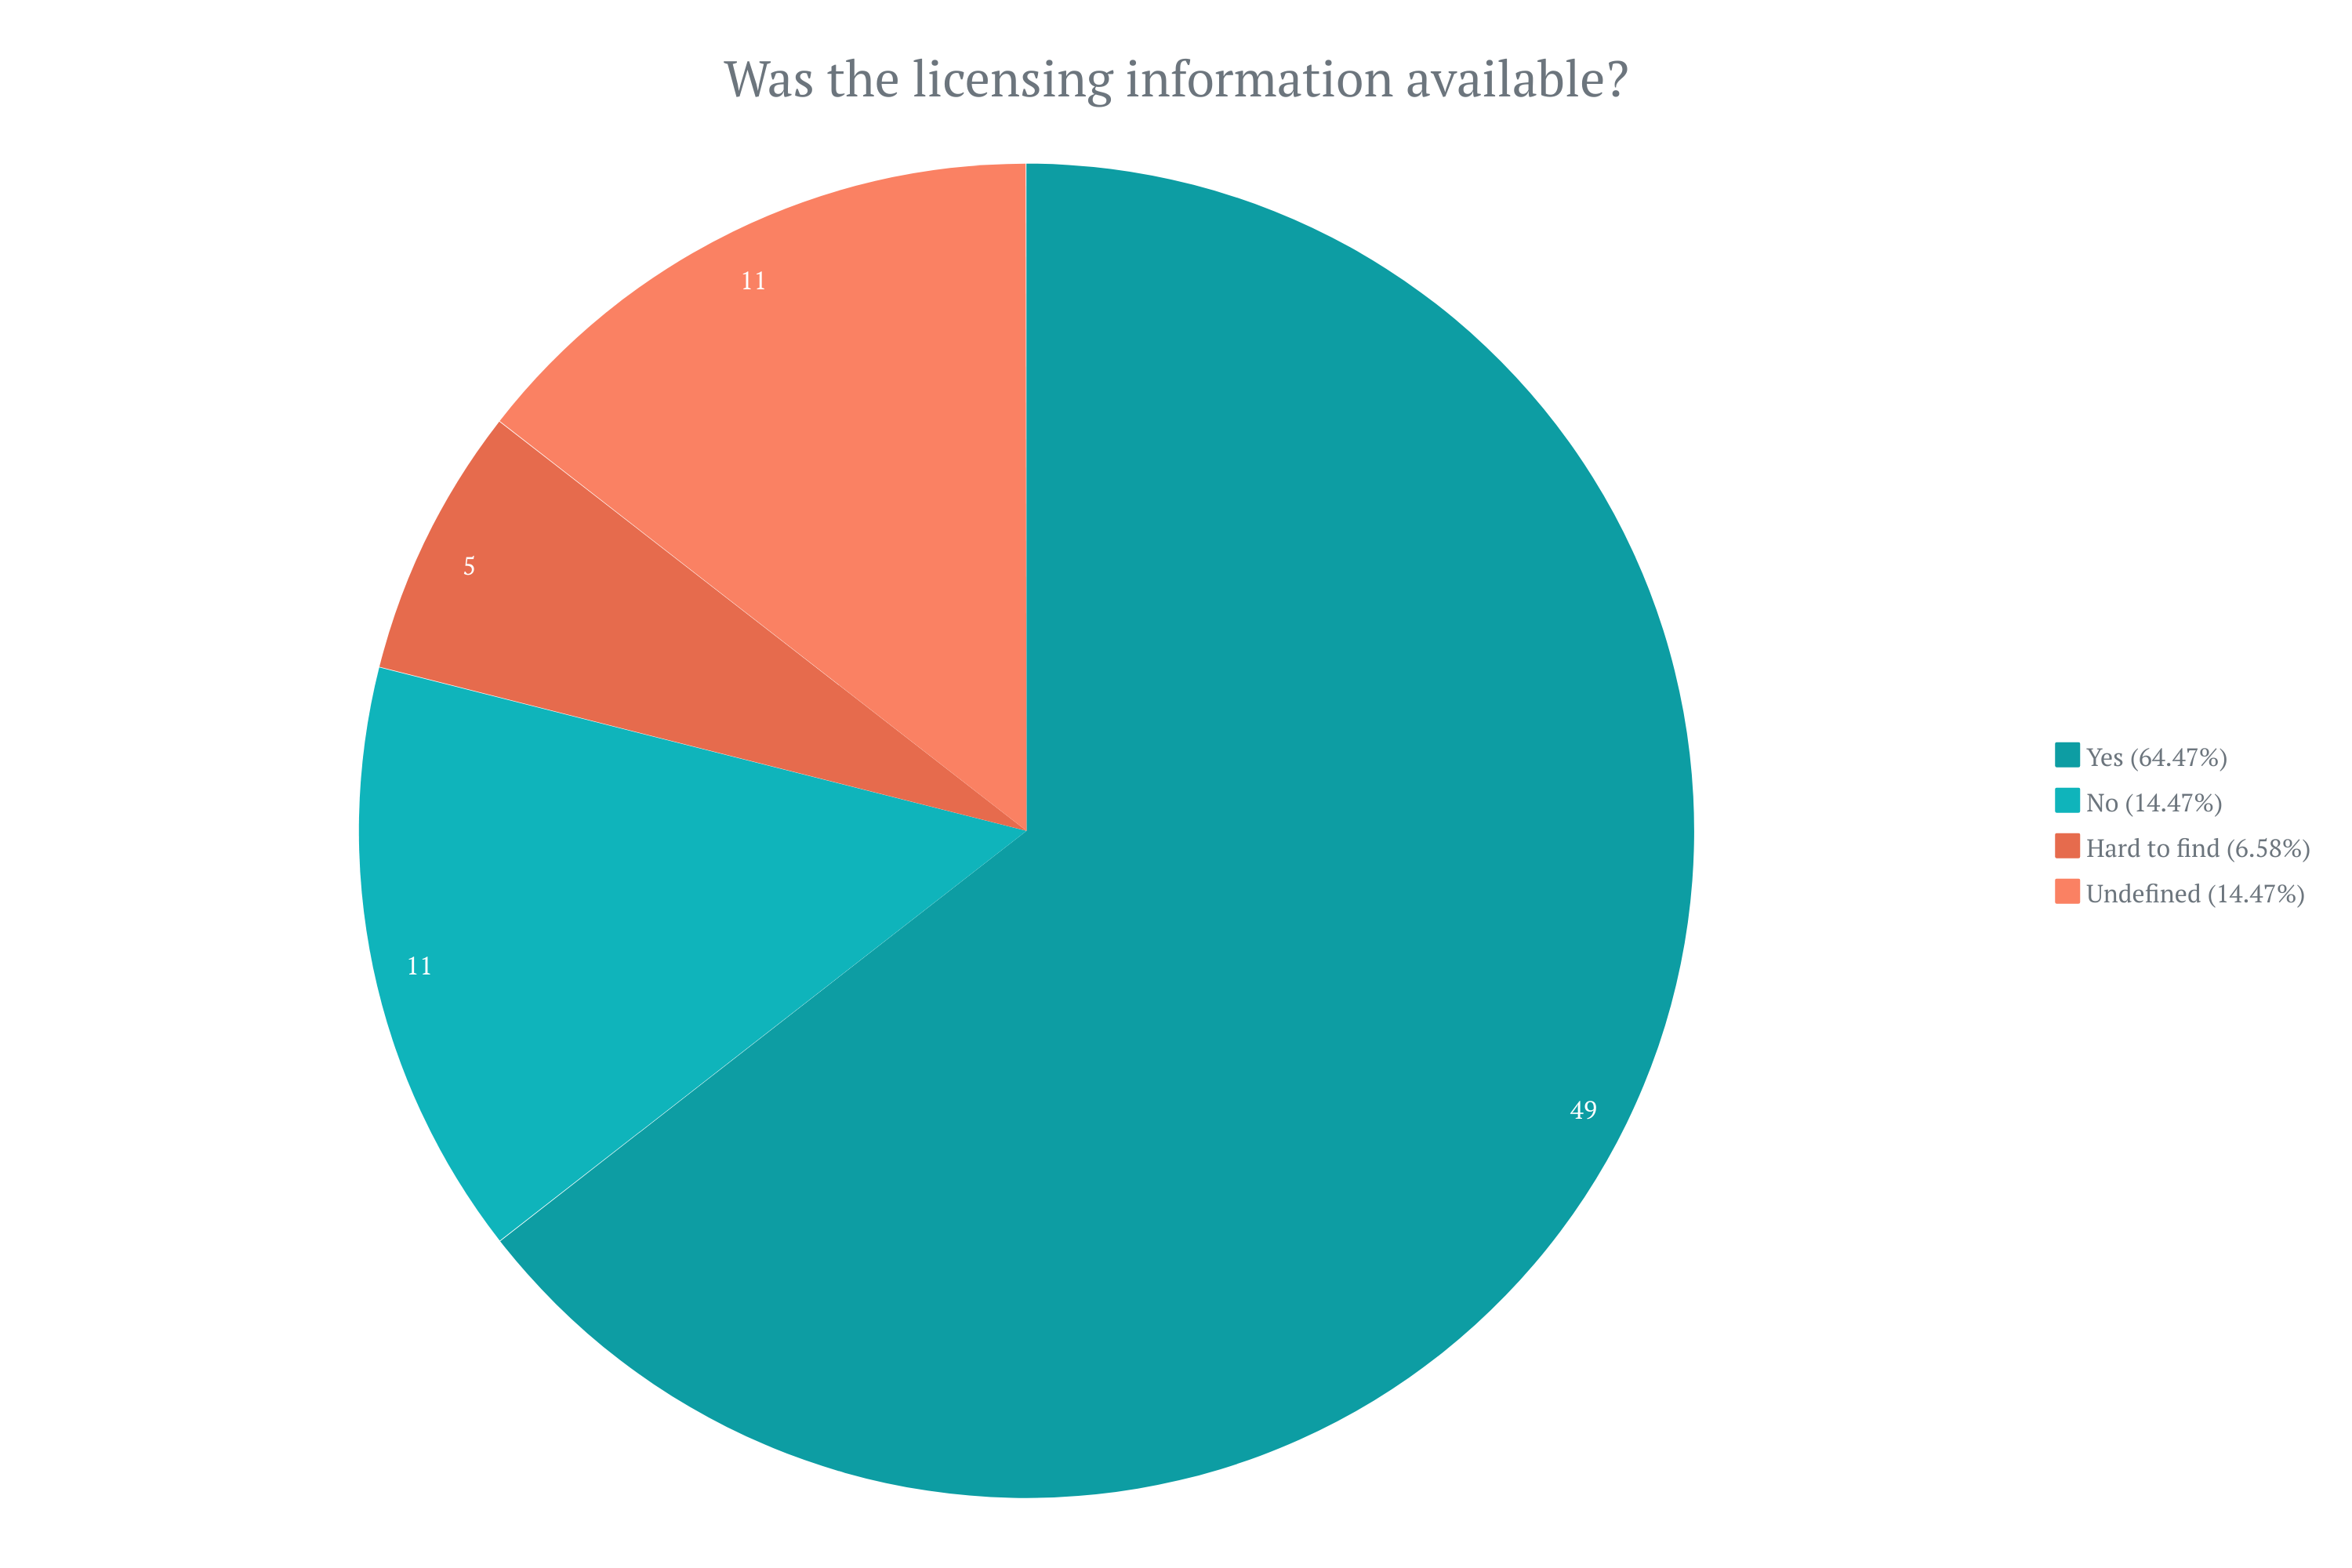
This question received a positive response of 64% (n=49). This result was not surprising. Some repositories have policies in place for applying licensing rules for deposited data. There is also an increasing awareness of the need for licensing with initiatives such as Creative Commons. The next question asked, 'Were most functions explained in sufficient detail in the user documentation and/or help facility to enable you to use them?' (Fig. 19).
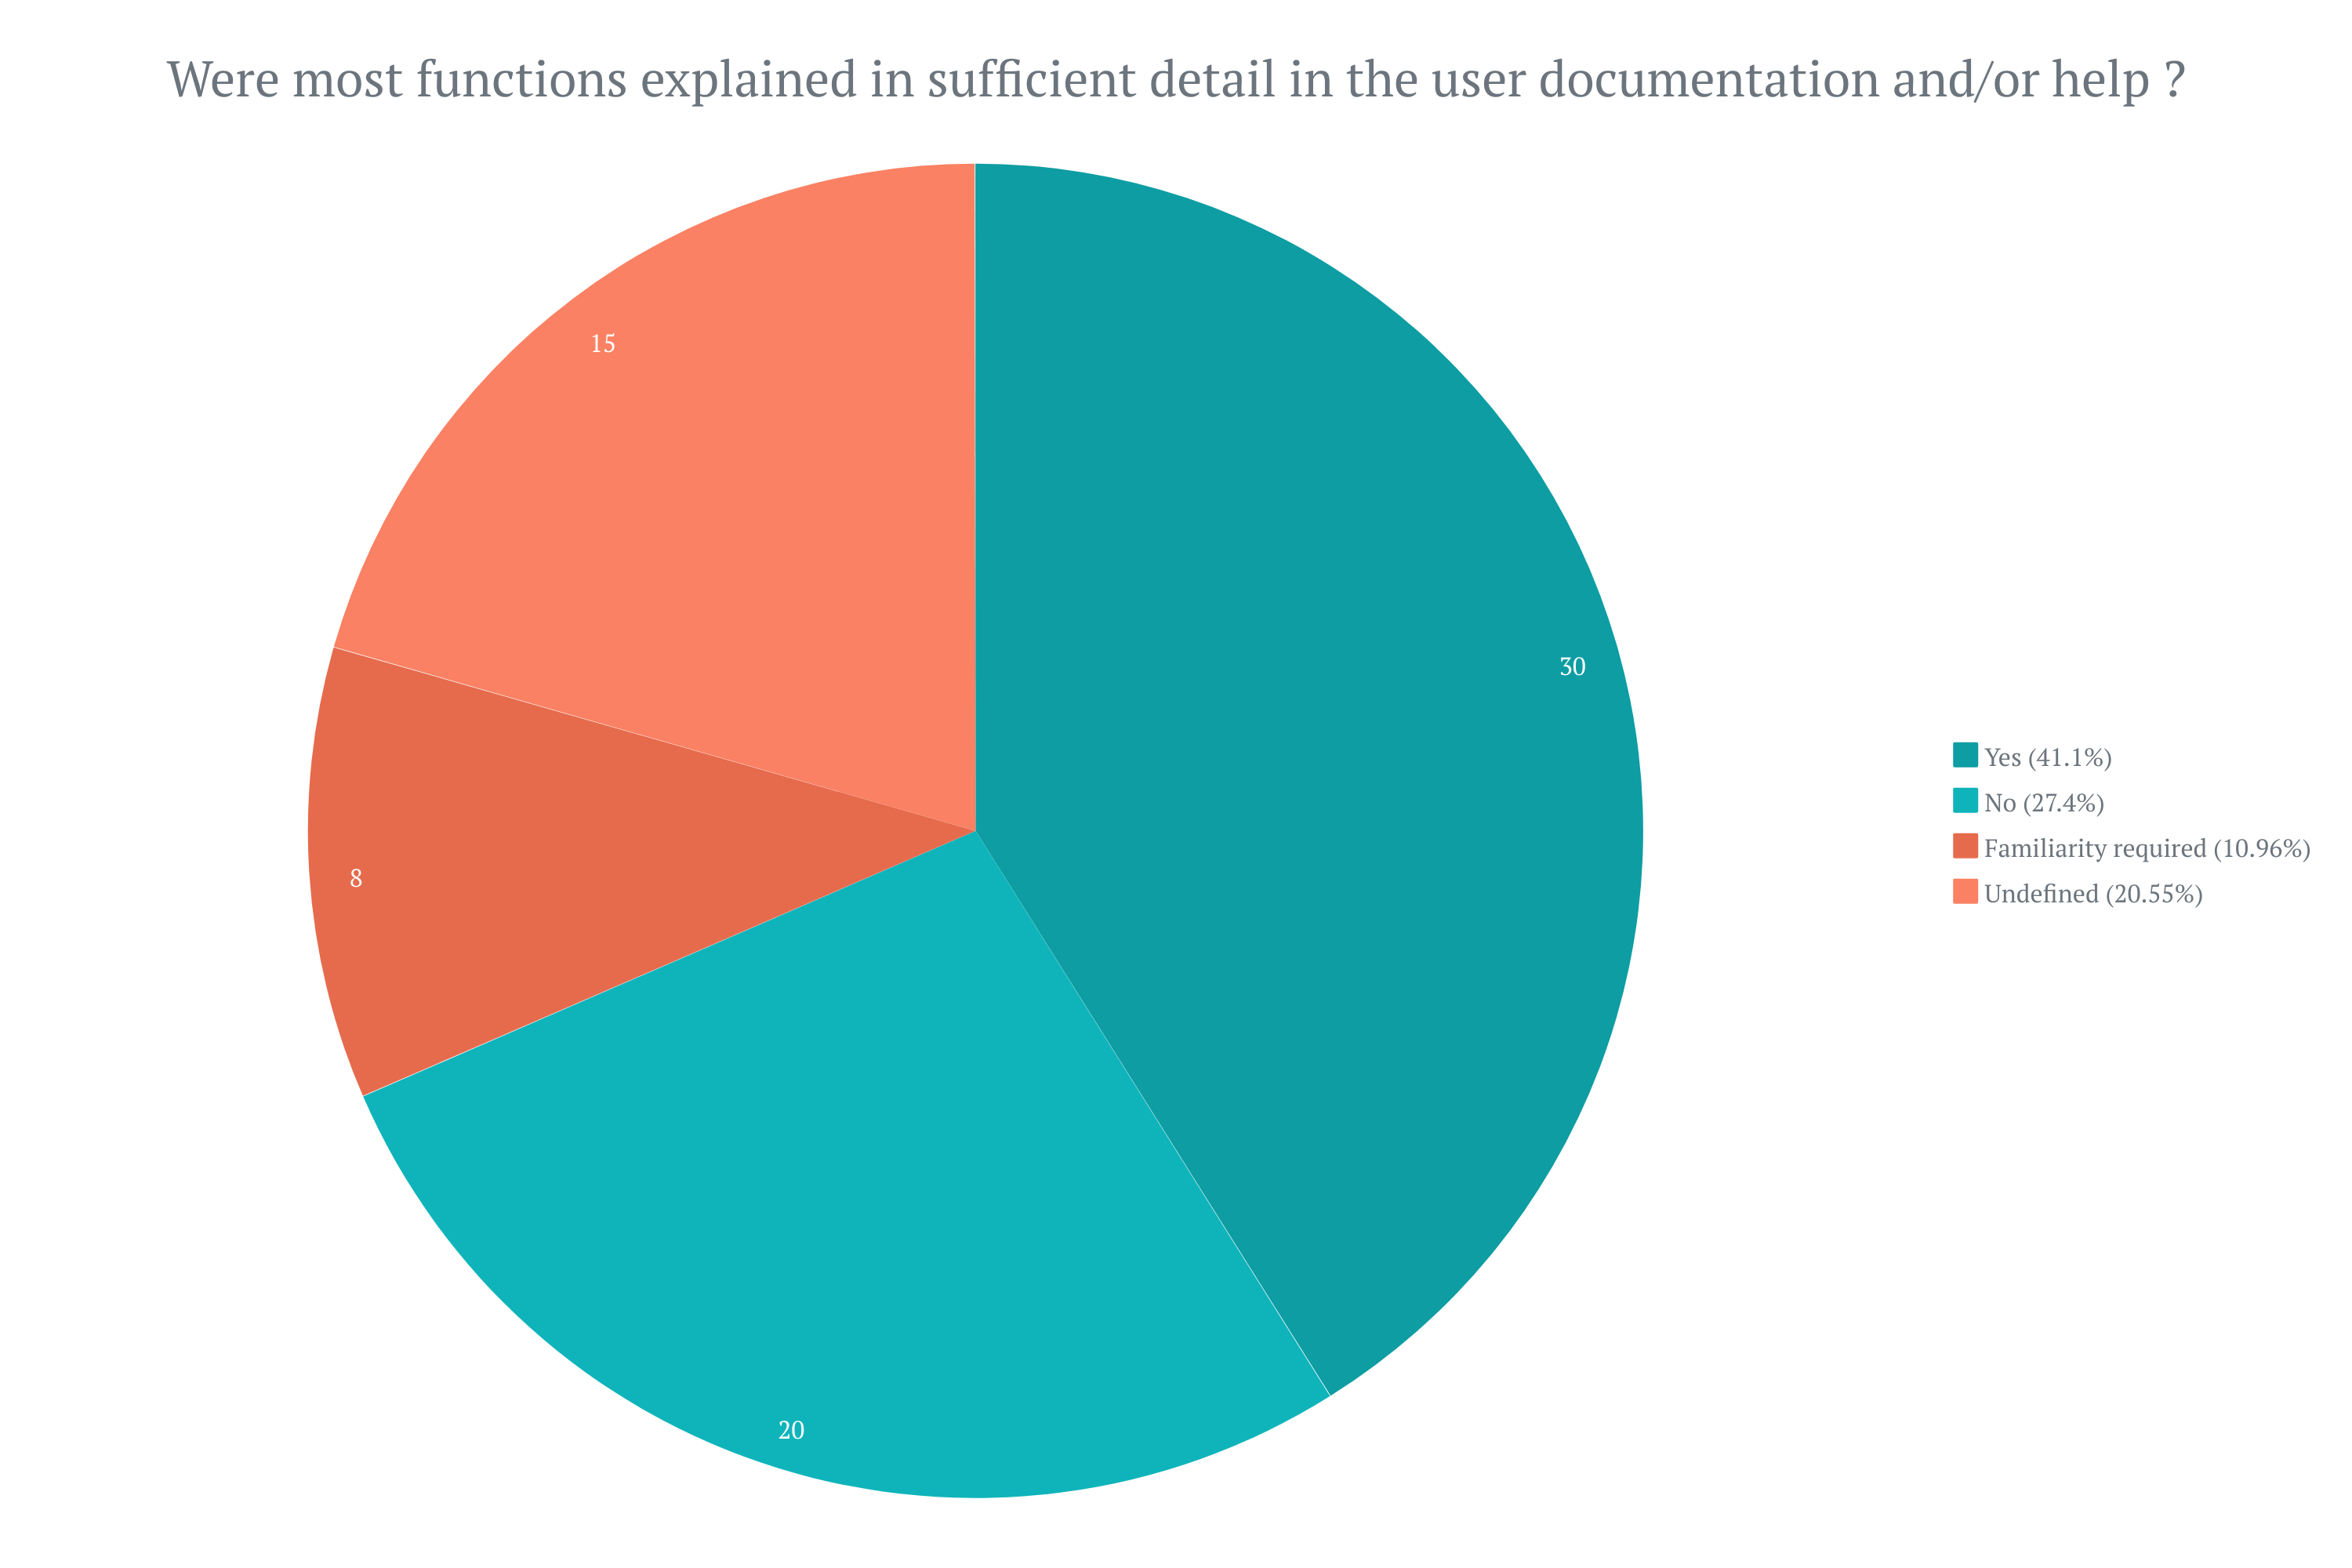
The result for this question was slightly lower, with 41% (n=30) of respondents answering positively. Some 11% (n=8) of respondents also suggested that the information was available, but familiarity with the platform was required to locate it. Several respondents commented that documentation was not required as the platform was easy to use and understand.
The final question in this section asked the respondent if they knew enough about the data that they could use it in their research. If the answer was no, the respondent was asked a final question to determine what they would need to use the data. There were 19 negative responses, and each respondent provided comments. The comments for this question echoed the previous comments made. Respondents struggled with a lack of metadata, documentation or licensing information, a dislike for registering to download the information, and data being in the wrong format or summarised in tables rather than providing the raw data.
Further analysis was done on user comments, and seven categories emerged. One of these categories was self-reporting. Several respondents noted that their familiarity with a platform influenced their high scores for satisfaction rates. However, one respondent who self-reported and selected extremely satisfied for the categories of ease of use features offered and pleasure using the platform selected scores of not at all satisfied and neutral for the remaining three categories. Despite being involved with the tested platform, they scored low for all categories. The same respondent scored 'trust' at varying levels as well. Regarding bias, the respondent still critically evaluated their tested platform.
Search functionality was often mentioned. Specifically, respondents noted a desire to enhance search functionality to allow searching by data type or to use search tools such as Boolean strings. The second issue was the quantity of data. Some platforms have plentiful data, yet searches yielded no results. Non-heritage platforms (for example, government spatial platforms) lack archaeological data. In contrast, other platforms need more data for searching. Some users stated that searches could have been clearer. One user noted that the platform has good functionality but a poor user interface, while others noted that the user interface was aesthetically pleasing, but the platform lacked functionality.
A recurring theme was resentment at having to register or log in to access data. One user that resented logging in said that some files still required special access. Another respondent commented that they would like to have summary reports available for the data to help determine whether they want to proceed with registering for an account. The tested platforms approach registration in various ways. For example, the ADS does not require registration at all, while DANS has an option for depositors to offer their data as fully open or to require registration before downloading.
The platform audience was addressed several times in the comments. Some platforms have a pleasing interface but are aimed at public audiences. As a result, these platforms lacked the functionality required for academic research; another category is reusability. Several platforms had data available; however, owing to the formats provided, the data were not reusable, or the data was not downloadable, while some files were reported as corrupted.
The final category was metadata. Respondents were asked specifically about metadata, and 23 responses were received. Several respondents stated they could not locate the appropriate datasets or the accompanying metadata. In addition, some of the metadata was unusable or corrupt. Barriers to using the metadata included an assumed familiarity with the dataset, a need for more detailed contextual information and language barriers. There was also a concern over how the metadata was controlled or mediated. One respondent was concerned that platforms were not enforcing a requirement on the depositors to include detailed metadata. Another respondent wanted the metadata to be mediated by museums as it is scientific information. One respondent also suggested that the data depositor should describe how their data might be (re)used in the future.
Research question one was addressed by developing a methodology for documenting the user experience when reusing digital archives and repositories. The validity of the methodology was tested by employing a survey. WG4 attempted to distribute the survey to professionals in archaeology and heritage. However, the distribution method proved limiting as most respondents were participants in the SEADDA COST Action. While contributions beyond SEADDA were welcomed and encouraged, the time frame for collecting responses could have been better. In future, a more comprehensive distribution method could be used to collect data from a broader audience. This approach can be addressed in future survey iterations and would prove helpful. The primary drawback is that the responses presented here are less broad than WG4 anticipated.
Other limitations to consider are bias and survey length. Bias within the survey was addressed throughout the survey design process. However, the uneven uptake regionally and multiple responses from individuals limited the value of analysing geographic patterns. Additionally, with a 20% dropout rate, the survey needed to be shorter. Dropouts often occurred in the final qualitative section of the questionnaire. The survey length was considered during the design phase, but a tension existed where WG4 wanted to stay true to the structure of the ISO 25022 standard. Improvements could be made here as there was occasional duplication between questions in the user scenarios and the qualitative questions.
Feedback received during the 2022 workshop emphasised that several users felt overwhelmed by choosing which platform to test. Again, this was something that had been discussed during the design phase. Limiting the platform choice would have enabled comparative data between responses received. However, by giving respondents a choice, we collected a list of 41 platforms, highlighting one of the challenges archaeologists face when locating data. Where should you start trying to find data? While findability has been addressed in FAIR and by significant investments made in recent years, knowing where to start or which resource to use is still a barrier. Aggregation websites, such as ARIADNEplus, can mitigate some of these challenges but are limited to partners who want to participate.
Research question two aimed to identify the barriers to the use and reuse of archaeological archives and repositories. The main difference of our methodology, compared to the previous research on archaeological or heritage data archives, is not the focus on the quality, as software, system or data characteristic, but on the quality of interaction between the archive (including software solutions, user interface, data, metadata, paradata) and the user. Furthermore, we sought to understand how specific users can use the digital archive to meet their distinct needs and goals. Following this approach, the identification of barriers to the reuse of archaeological archives could be divided into two parts (i) the characteristics of digital archives and repositories (as measured trends), disabling the user's ability to use and reuse data; (ii) the reasons, explaining why these characteristics are developed and exist in digital archives.
Data analysis revealed several barriers that hinder a user's ability to reuse data. These five 'disabling characteristics' relate to flexibility, licensing, documentation, functionality and the quantity and quality of data.
The response rate for data flexibility provides an opportunity for improvement. While 50% of respondents could export the data, only 12% were satisfied with the file formats offered for download. One respondent astutely pointed out that the depositor, not the platform, determines data structures. Data repositories provide freedom for depositors to decide which file formats to use. However, this freedom must be translated for data users and impacts reusability. Data flexibility scored low in the survey; only 36% of respondents were satisfied with the file formats offered. Comments focused on the need to manipulate or reconfigure data before it could be used. PDF files were the most disliked, as they offer no flexibility despite being downloadable. In addition, respondents hated having to register to access or download data. Archaeological data is diverse, with various file types and preservation needs (Richards et al. 2021). How do we encourage depositors to provide formats that data reusers need? Repositories can provide guidance, such as the Guides to Good Practice written by the ADS and Digital Antiquity (Archaeology Data Service and Digital Antiquity 2013). However, if those guidelines became enforceable mandates, it could imply that archaeologists hold no personal responsibility for data quality.
Many data archives and repositories have policies in place for applying licensing rules to deposited data, demonstrated by 64% of respondents being able to locate licensing information. There is also an increasing awareness of the need for licensing with initiatives such as Creative Commons. However, respondents' struggled to find licensing information in general, with information buried in linked pages, unclear details provided or different licensing terms applying to individual items in a single archive. Despite the positive response rate, more work must be done in this area.
Platforms should provide user documentation or other mechanisms to assist users in exploiting the full functionality available to them. Unfortunately, the response rate for locating this user documentation was much lower than the licensing question, with only 41% of respondents able to locate appropriate documentation. In addition, 11% of respondents commented that familiarity with the platform was required to find the required documentation. Finally, several respondents commented that documentation was unnecessary as the platform was easy to use and understand.
This survey aimed to explore the functionality of underlying search infrastructure for digital archives and repositories. One barrier to testing the functionality of these interfaces was that respondents struggled to find an appropriate dataset. For the 3D Pottery scenario, half of the respondents could not locate an appropriate dataset. This result varied across the different scenarios. For example, in the GIS #2 scenario, 75% of respondents could locate a dataset, with the remaining 25% responding 'partially' to this question. The search tools to find data were also considered lacking. Search functionality was mentioned in the comments. Respondents desired to enhance search functionality to allow searching by data type or to use search tools such as Boolean strings. One user noted that the platform has good functionality but a poor user interface, while others indicated that the user interface was aesthetically pleasing but lacked functionality. Many platforms require users to register to view or export data. Respondents resented registering or logging in to access data, with some files requiring special access. Another respondent commented that they would like to have summary reports available for the data to help determine whether they want to proceed with registering for an account. Within archaeology, there can be a need to protect sensitive data, such as geographic information, for sites at risk of looting (Sheehan 2015, 188). Data can adhere to FAIR without being completely open, recognising that open is only sometimes appropriate (Wilkinson et al. 2016). The tested platforms approach registration in various ways. For example, the ADS does not require registration at all, while DANS has an option for depositors to offer their data as fully open or to require registration before downloading.
The quantity of data available would appear quite large, given that respondents tested 41 distinct platforms. However, there is a perception of a lack of available data. This perception could be attributed to the inability to locate data, as discussed above. While some platforms have plentiful data, searches yielded no results. In contrast, respondents commented that some platforms have adequate search functionality but need more data for searching. In addition, non-heritage platforms (for example, government spatial platforms) lack archaeological data. The audience for the platform also influences the type of data available, affecting both the aesthetics of the platform, as well as the flexibility of the data.
There was no specific measure for data quality. Trust can be used as an approximation for the perceived quality of the data and the metadata. Anecdotal evidence would suggest that trust in other people's data is relatively low. However, the levels of trust reported by respondents were much higher than their satisfaction with the platforms tested. For the first question, 'Was there enough metadata for you to understand the dataset?', 60% of respondents were highly confident. The scores vary between user scenarios, with 90.9% of C14 respondents being satisfied with the metadata available but less so with GIS respondents, where 37.5% were not satisfied. Despite this, the GIS #3 respondents were still willing to use the dataset without the requisite metadata. One interpretation of this response is that there had been a shift in trust.
Researchers previously preferred to get data from colleagues or based on an individual's reputation (Faniel et al. 2013, 301). Data repositories now carry authority based on their reputations, resulting in a shift in trust from the individual to the institution. It was reported that some users in the community expect that the data they find in repositories has been peer-reviewed. While journals such as the Journal of Open Archaeology Data and Internet Archaeology publish peer-reviewed data articles, this is not the case for all data held in digital archives or repositories. Data repositories can apply for Core Trust Seal accreditation that evaluates data repositories against 16 requirements (CoreTrustSeal 2017). Again, this measure does not apply to all archives or repositories. Alternative interpretations need to be offered for this shift in trust and need to be explored further.
Testing a range of scenarios aimed to discover if the type of data respondents worked with impacted the user experience when searching in digital archives. The highest response rate was for the GIS scenarios. These respondents also scored highly on locating data, effectiveness, efficiency, satisfaction and trust. Comparing the use case scenarios, the main 'disabling characteristics' are:
Respondents testing the GIS scenarios had the most difficulty downloading copies of the data without registration, finding and exporting the data in a reusable format, filtering searches by topic (for example, archaeological site type, sampled material, user-defined area or chronology), finding clear licensing information for data reuse, and finding information (discovery metadata) and adding and using Web Services.
Other GIS-related 'disabling characteristics' noted by respondents were:
Respondents testing the C14 scenario had difficulty achieving the primary task of downloading digital files containing stratigraphic relationships between stratigraphic units with associated C14 dating evidence. In addition, respondents could not search or find specific radiocarbon sample data within the digital platform using sample numbers. Respondents did not identify other radiocarbon-related specific 'disabling characteristics'.
Regarding the tasks in these scenarios, respondents had the most difficulty with exporting 3D data in a reusable file format; filtering or searching by chronology, material, geography, or typology for pottery; finding high-resolution 3D models of archaeological pottery; and using 3D visualisation platforms to view and store their 3D data
Other 3D Pottery-related 'disabling characteristics' are:
The Quality-in-Use survey aimed to collect data on the qualitative experiences of data users. Some limitations were a result of sticking closely to the ISO 25022 standard. The feedback from the survey was mixed. When the results were presented to SEADDA members at a workshop in Braga, the conclusion was made that the methodology works, but the execution could be improved. The limitations included the survey format, user-friendliness, overwhelming participants with choice, distribution method, and a need for comparative data.
Participants found choosing a platform for testing overwhelming. WG4 had made a conscious choice not to single out individual repositories or narrow the scope of results received. However, in future iterations of the survey, this should be reconsidered. In addition to user comfort, narrowing the choice of platforms for testing would provide more opportunities to compare survey results, which was lacking in this first survey. The survey could have been more user-friendly, and at times there was duplication between the tasks asked of respondents. Standardising the tasks across new data types or making tasks more complex could address this. There is an opportunity to perform a second survey and advance the development of the Quality-in-Use methodology.
Another limitation of the survey was the distribution method. The survey was primarily distributed to SEADDA members, thus failing to address the variety of user communities in archaeology. Future directions should be discovering who uses archaeological data and what data reuse means to them. Qualitative data should be collected to understand their experiences. However, to facilitate this, there is a need to move away from the original format of a survey. Future directions should acknowledge the feedback provided and collect data on a more personal level, such as through workshops or interviews. Guided workshops are a way to walk participants through the methodology, where they can then test a dataset and answer survey questions. This approach provides an opportunity to address different user communities, for example, by asking a group of commercial archaeologists or museum visitors to participate and understand how their expectations vary. Further opportunities to develop the methodology would be to expand and test other data formats, expand on use cases by increasing the complexity of tasks, evaluate data quality, and broaden audience participation.
The Quality-in-Use survey evaluated the user experience when searching for archaeological data. The survey provided interesting results, particularly concerning shifts in trust, the ability to locate data and the differences between working with different data types.
To address research question one, WG4 examined the methodologies and best practices found in scholarly literature and reports related to understanding and documenting the quantitative and qualitative reuse of archaeological archives. The decision was made to interpret reuse as a quality feature of the archaeological archive. Conceptually, product quality can be recognised and defined differently (Garvin 1984). However, in this case, WG4's interest in the use and reuse of digital archaeological data and the exploration of how digital archaeological archives can better respond to user needs provides a basis to focus research on a user-based conceptual product quality approach (Garvin 1984 27) and to relate the methodology to the information system quality measurement standardised approach defined as '...calculation, performed to combine two or more values of quality measure elements…' (International Organisation for Standardisation 2019 3). The standardised approach to information system quality measurement comprises different measurement frameworks such as Quality-in-Use, system and software product quality, data quality, and IT service quality (International Organisation for Standardisation 2019 v). Seeking to better respond to this research challenge, WG4 created a methodology to understand and document the reuse of archaeological archives based on a Quality-in-Use measurement standardised framework (International Organisation for Standardisation 2016). This framework also responds to the need for the complexity of research to investigate quantitative and qualitative kinds of reuse.
The discussion section of this article responded to research question two by outlining the barriers to the use and reuse of digital archaeological archives and repositories. The methodology defined quality as the interaction between the archive, software solutions, user interface, data, metadata, paradata and the user. Following this approach, the identification of barriers to the reuse of archaeological archives could be divided into two parts (i) the characteristics of the archives that limit the use and reuse of archaeological data; (ii) the reasons why these characteristics are developed and exist in digital archives. The identified characteristics that create barriers to data reuse relate to the 14 measures set out in ISO 25022. These barriers fall into the categories of flexibility, content completeness and user trust.
The reasons why these 'disabling characteristics' are developed and exist in digital archives are related to the evolution of digital archaeological archives in the context of the change in the field of scholarly archaeology, digital information technologies and related societal, regulatory, and institutional structures. The main reasons are:
The final research question was to recommend how archaeological archives can better respond to user needs. The solutions are related to eliminating the reasons for 'disabling characteristics' or developing digital tools to reduce the negative impacts of these reasons.
Maximising the discovery, use and reuse of archaeological data is imperative for both heritage professionals and non-professionals. Crucially, archaeological archives need to optimise search capabilities and user interfaces to respond better to contemporary society. The barriers have been mentioned here, but there is also some worldview-related baggage. Part of the barriers may emerge from the perceived loss of control over the use of digital objects, possibly prompting archaeological institutions to limit the access and use of their digital assets, thus hampering the realisation of wider societal value digitisation is expected to bring and decreasing the possibilities of creating additional values via 'sharing economy' models. Most digital archives created by archaeological institutions are based on an authoritarian, 'top-down', curatorial approach, according to which the creators of the archive are perceived as the expert who knows the public's needs and creates the product offered to them. Suppliers and customers are in strongly fixed positions, where archive creators are active suppliers and members of archaeology-related professions, while non-professional communities are passive consumers of archives without the ability to use participatory tools, reuse data or co-create digital content. Participatory models need to change worldview-related characteristics and use democratic, 'bottom-up', open, crowdsourced archives. Marttila and Botero (2017 97) express that '...co-design activities and infrastructure strategies in relation to a broader interest in advocating not only the preservation of and access to digital cultural heritage, but, more importantly, enabling collaboration, to support the emerging practices of diverse user groups, and to contribute to cultural commons…' which will strengthen the pluralistic consensus-based paradigm in the digital archaeology sector. To achieve this, understanding Quality-in-Use can be useful both at a conceptual level, as a driving concept, and as a measurement tool.
This survey started at the end of one process and the start of another, after data have been archived and before reuse. The problem is multi-faceted, and other methods can be used to try and understand the problem. Despite remaining work, the survey demonstrates that archaeological data are available and that the search tools archaeologists have at their disposal do work. However, challenges persist, particularly in knowing where to look. This problem is not the same as findability, as defined by FAIR principles. Further development and training will address this issue. The Quality-in-Use methodology developed here could be developed into a quality assurance workshop, in a more controlled environment with more narrow parameters. Special consideration should be given to the target audience, the workshop format and the platforms being tested. Platform familiarity is crucial for increasing usability, and professional development and training can enhance user comfort and proficiency.
The authors are grateful to the members of WG4 for discussions, constructive criticism and valuable comments on the research presented in this article: Pedro Luengo, Universidad de Sevilla; Markos Katsianis, Department of History and Archaeology, University of Patras; Despoina Tsiafaki, Culture and Creative Industries Department, Athena - Research and Innovation Center in Information, Communication & Knowledge Technologies; Piraye Hacigüzeller, University of Antwerp.
All authors are members of Working Group 4, 'Use and Reuse of Archaeological Data' of the COST Action 'Saving European Archaeology from the Digital Dark Age' (SEADDA) CA18128, and acknowledge financial support by the European Cooperation in Science and Technology – COST Programme (Horizon 2020 Framework Programme of the European Union).
quantitative-survey-results
This CSV file contains the quantitative data generated as a result of the SEADDA WG4 Quality-in-Use Survey.
key-legend
This CSV file describes the fields and numeric values expressed in quantitative-survey-results
task-weighting
This CSV file lays out the weighted values assigned to each task in the Use Case Scenarios that were used to calculate effectiveness and efficiency.
Internet Archaeology is an open access journal based in the Department of Archaeology, University of York. Except where otherwise noted, content from this work may be used under the terms of the Creative Commons Attribution 3.0 (CC BY) Unported licence, which permits unrestricted use, distribution, and reproduction in any medium, provided that attribution to the author(s), the title of the work, the Internet Archaeology journal and the relevant URL/DOI are given.
Terms and Conditions | Legal Statements | Privacy Policy | Cookies Policy | Citing Internet Archaeology
Internet Archaeology content is preserved for the long term with the Archaeology Data Service (ROR). Help sustain and support open access publication by donating to our Open Access Archaeology Fund.
 Home
Home