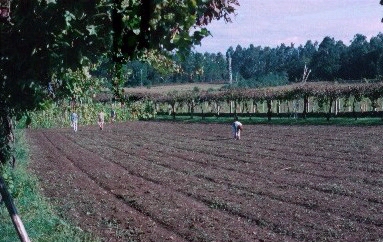
Fig. 4.1. Fieldwalking to the north of the Rio Este
The objectives of the survey required us to study a representative sample of the landscape. Initially it was decided to replicate the sampling strategy used in the Tarragona survey (Carreté et al. 1995, chapters 2 and 3), by examining a series of northsouth 1km wide transects between the Rio Ave and Rio Cávado. This project design was intended to sample variation across the grain of the landscape, enabling us to examine any contrasts between areas (1) with distance from the coast, (2) close to and further from the Roman town of Bracara Augusta (Braga), (3) on the different geologies, and (4) at varying altitudes. We had hoped to survey four transects, one just inland from the coast, the second and third to the west and east of Vila Nova de Famalicão, and the fourth in the vicinity of Guimarães.
In the first season of fieldwork we began by examining an area in the middle of the second transect, in the Este valley adjacent to Professor Queiroga's excavation on the castro site at Penices. It rapidly became clear that restricting ourselves to a 1km wide transect would result in very limited coverage. This was because, in contrast to the Tarragona area, only a small proportion of the landscape was available for survey in a September-October season. Much of the land was built-up, under dense forestry, or otherwise unavailable because of the crop regime. After consideration, it was decided to broaden the transects to 4km, not with the expectation of fieldwalking the whole of the available area, but rather to allow us to select groups of contiguous fields within this strip in order to make up a northsouth band approximately 1km wide, avoiding those areas which were impossible to access.
As the project developed, it further became clear that the terrain around Guimarães was such that it would be impossible to obtain good fieldwalking coverage in the time available. It was therefore decided that our time was better invested in examining the land in the two transects nearest the coast in as much detail as possible within the time available, leaving the areas further inland for possible investigation at a later date.
Fig. 4.1. Fieldwalking to the north of the Rio Este
Within the transects selected, the field methodology was straightforward. There was first a reconnaissance visit in which areas that were available for walking were identified. Fields were considered appropriate for walking if they had been ploughed or where crops had been harvested leaving a good proportion of the weathered soil surface visible. In many cases, this meant that areas recently cleared of maize could be walked. The selected fields were then each visited in turn by the fieldwalking team (Fig. 4.1). The majority of the fields within the area were less than 1ha in extent, with the mean field size being 0.64ha. Individual fields were thus generally treated as a single collection unit, exceptions being made only where a field was unusually large or divided by a key topographic feature. The boundaries of each field were marked on an overlay to the published 1:10,000 maps which covered the area (Table 4.1). Each collection unit was allocated a sequential number.
| Transect 1 | Transect 2 | |
|---|---|---|
| Sheet 68-2 | Sheet 69-1 | Sheet 69-2 |
| Sheet 68-4 | Sheet 69-3 | Sheet 69-4 |
| Sheet 82-2 | Sheet 83-1 | Sheet 83-2 |
| Sheet 82-4 | Sheet 83-3 | Sheet 83-4-1 Sheet 83-4-3 |
| Sheet 96-2 | Sheet 97-1 | Sheet 97-2-1 Sheet 97-2-3 |
A proforma was completed for each field, recording the following details (these details form the basis of the fieldwalking dataset; or query the fieldwalking dataset spatially via the map interface):
Each field was line-walked by the team spaced at approximately 5m intervals. They inspected the whole of the available surface and collected any finds, with the exception of obviously modern material. The finds from each field were then bagged- up together and the field number marked on the bag. Any obvious concentrations of finds were noted at this stage and an attempt was made to define their limits and sketch them on the map.
| Year | Transect 1 | Transect 2 |
|---|---|---|
| 9-22 September 1994 | Fields nos 1-136 | |
| 13 September - 2 October 1995 | Field nos 137-412 | |
| 9 September - 3 October 1996 | Field nos 584-728 | Field nos 413-583 |
| 17-29 September 1997 | Field nos 729-815; 829-855 | Field nos 816-828 |
The finds were washed, sorted and a basic inventory was recorded before they were boxed and stored for later study. On the basis of the preliminary inventory and field observations, a series of possible sites were identified using the density of finds as the criterion. This provisional categorisation forms the basis of the maps published in successive interim reports. In cases where there was some uncertainty, such locations were revisited and a second walk was undertaken to recover further material. In addition, in the 1995 and 1997 seasons a series of these potential sites were further examined through geophysical survey in an attempt to map any sub- surface features (see sect 6.3.1). During these geophysical surveys further finds were also recovered. The finds from second walking of sites were recorded separately so that the densities of finds from the first survey could be used consistently in the definition of probable settlements.
Query the fields walked by the map interface (Map 3)
Query pottery details from the first walk |
Query tile details from first walk
Query pottery details from the 2nd walk (124 records) |
View tile details from 2nd walk (10 records)
| Year | Total area covered |
|---|---|
| 1994 | 78.39ha |
| 1995 | 183.89ha |
| 1996 | 183.76ha |
| 1997 | 100.44ha |
| Total | 546.25ha |
It was decided at an early stage in the project that the best results could be obtained through an analysis of the survey material using a computer-based Geographical Information System (henceforth GIS). It was therefore decided to save the full analysis of the data until fieldwalking was completed. The strategy followed in processing was straightforward. As in the Tarragona survey, it was felt that the definition of potential settlement sites should be based on the identification of above average concentrations of surface finds. To isolate these, it was necessary first to classify and quantify the ceramics found and to map their varying densities across the surveyed areas.
It was agreed from the beginning of the project that the mapping should be based on digital data. As such digital data were not available, it was necessary to produce them from published maps. This work was undertaken by Kris Strutt, part of it being used as the basis of an MA dissertation (Strutt 1998; 2000). The data used to construct the GIS came from the following sources:
In addition, the basic field survey and finds information were entered into databases linked to the digitized map coverages. These data have been used to create the maps published here and also to derive various other pieces of information relevant to the analysis of the survey results (Section 6).
Download GIS data from digital archive held by ADS
(link opens a new window)
Data concerning the physical environment of the region are derived from maps which represent the modern landscape in a static form. By contrast, although the landscape has not been significantly altered in the past two millennia, it is clear that there have been a number of landscape changes which are not adequately displayed on the maps but which have affected the current distributions of Iron Age and Roman settlement. It is therefore vital to analyse the distribution of identified sites in relation to these landscape changes before any broader conclusions about ancient settlement patterns are drawn (See section 6).
| Transect 1 | Transect 2 |
|---|---|
| 160.58ha | 385.67ha |
| 2.01% of 4km transect | 4.82% of 4km transect |
| 8.03% of 1km target | 19.28% of 1km target |
| Alluvium | 10.21 ha |
|---|---|
| Fluvial terraces | 33.33 ha |
| Granite | 322.99 ha |
| Mineral veins | 1.78 ha |
| Schist | 177.95 ha |
| Total | 546.25 ha |
© Internet Archaeology
URL: http://intarch.ac.uk/journal/issue9/millett/survey.html
Last updated: Sat Dec 30 2000