Cite this as: Gaffney, V. et al. 2020 A Massive, Late Neolithic Pit Structure associated with Durrington Walls Henge, Internet Archaeology 55. https://doi.org/10.11141/ia.55.4
The interpretation and significance of pits, either as isolated features, clusters, or forming parts of larger structures or alignments, is a significant issue within British later prehistory (Anderson-Whymark and Thomas 2011; Bailey 2018; Blinkhorn and Little 2018; Darvill 1997, 176; Garrow 2006; 2007; Hill 1995; Roberts and Marshall 2020; Thomas 1991, 59-64). Consequently, the relative ubiquity of pit digging, and the varied contexts associated with their discovery, has generated an extensive literature and equally varied interpretations of the role of these features. From relatively prosaic associations with settlement, functional links with specialist activities such as mining, through to proxies for the arcane; pits within British prehistory are, as Garrow concluded for the British and Irish Neolithic, 'a diverse phenomenon' (Garrow 2011, 219).
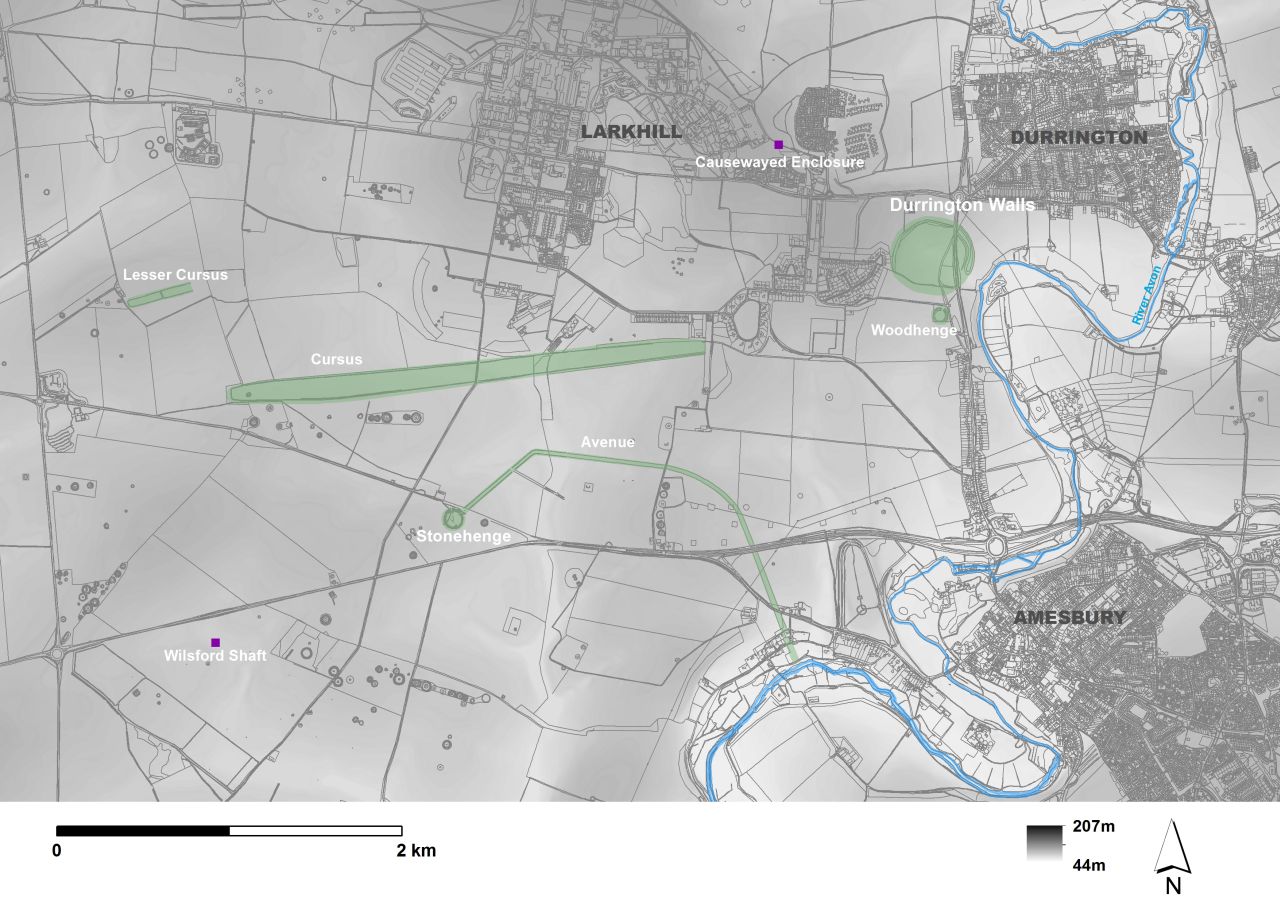
Within the Stonehenge landscape specifically, the potential significance of such features has long been recognised for many archaeological periods associated with the development of the monument and its landscape (Figure 1). Key features include the alignment of pits discovered during construction of the car park adjacent to the old Stonehenge visitor centre (Cleal et al. 1995, 41-7). Here, a small group of pits has been dated to the early 9th millennium BC and associated with a variety of functions including the settings for totem poles marking a special place, props for the hunting of aurochs and links to lunar observation (Allen 1995, 472; Jaques and Phillips 2014, 24; Loveday 2012). At a later date within this landscape, the pit discovered during magnetic surveys prior to the excavation of Coneybury Henge, and often referred to as the Coneybury Anomaly, has been associated with the remains of Neolithic feasting (Richards 1990, 40-61). More recently, re-analysis of the pit's contents has suggested this feature was also associated with occasional contacts between hunter-gatherer and farming communities that coexisted in the Stonehenge area (Gron et al. 2018). Also present was another substantive feature, the Wilsford Shaft, excavated in 1960-2. Surrounded by a bank, and initially interpreted as a pond barrow (Ashbee et al. 1989), the central shaft measured 6m in diameter at the surface, tapered to 1.8m at a depth of 6m, and descended vertically to a depth of 30m. Although well-like in appearance, the shaft is usually interpreted as a ritual structure containing a range of deposits. Generally dated to the Middle Bronze Age, there is an associated Late Neolithic date from a wooden bucket at the base of the shaft (Housley and Hedges 1989).
Such spectacular features do not, however, represent the full range of pit-like features recorded through excavation, geophysical prospection or aerial survey within the Stonehenge landscape. These include isolated pits, pit groups, or even tree holes incorporating archaeological material, which may be purposeful but frequently defy interpretation at an individual level. However, specific pits, frequently located through remote sensing, may also achieve significance through their wider spatial or geographical context, or their relation to other pits or archaeological features. Such a situation is encapsulated by the two large pits located within either end of the Greater Cursus and located during fieldwork undertaken by the Stonehenge Hidden Landscapes survey project (Gaffney et al. 2012). The visual connections of these pits with the area of Stonehenge itself suggest a complex linkage between the emergent monuments and the surrounding landscape.
Clusters of pit-like features that form larger groups, some of which may be interpreted as monumental structures in their own right, are also evident across the Stonehenge landscape (Gaffney et al. 2018, fig.1). Within the context of this article, it is important to note the large pit circle identified by ground penetrating radar beneath the banks of Durrington Walls followed survey by the SHLP (Gaffney et al. 2018). Up to 90 anomalies, measuring up to 4.5m in length and c. 1.5m in width, were identified following survey, but the circuit may have originally included several hundred similar features. Together, these form a major alignment largely coincident with the later bank of the henge. Initially interpreted as containing individual stones, excavation demonstrated that at least some of these features contained large wooden uprights. The arrangement of these pits is interpreted as a distinct structure that was not necessarily intended to prefigure henge construction or emulate henge enclosure design (Gaffney et al. 2018).
These recent studies demonstrate the potential for remote sensing survey to provide new evidence for hitherto unknown features or monumental structures around the henge at Durrington Walls and that this information can supplement the results of recent, large research projects on and around the monument (Gaffney et al. 2012; Gaffney et al. 2018; Parker Pearson et al. 2004). Analysis of the larger SHLP datasets, now being undertaken in preparation for publication, is likely to reveal further evidence for landscape structure as information is aggregated relating many hundreds of features and their spatial relationships.
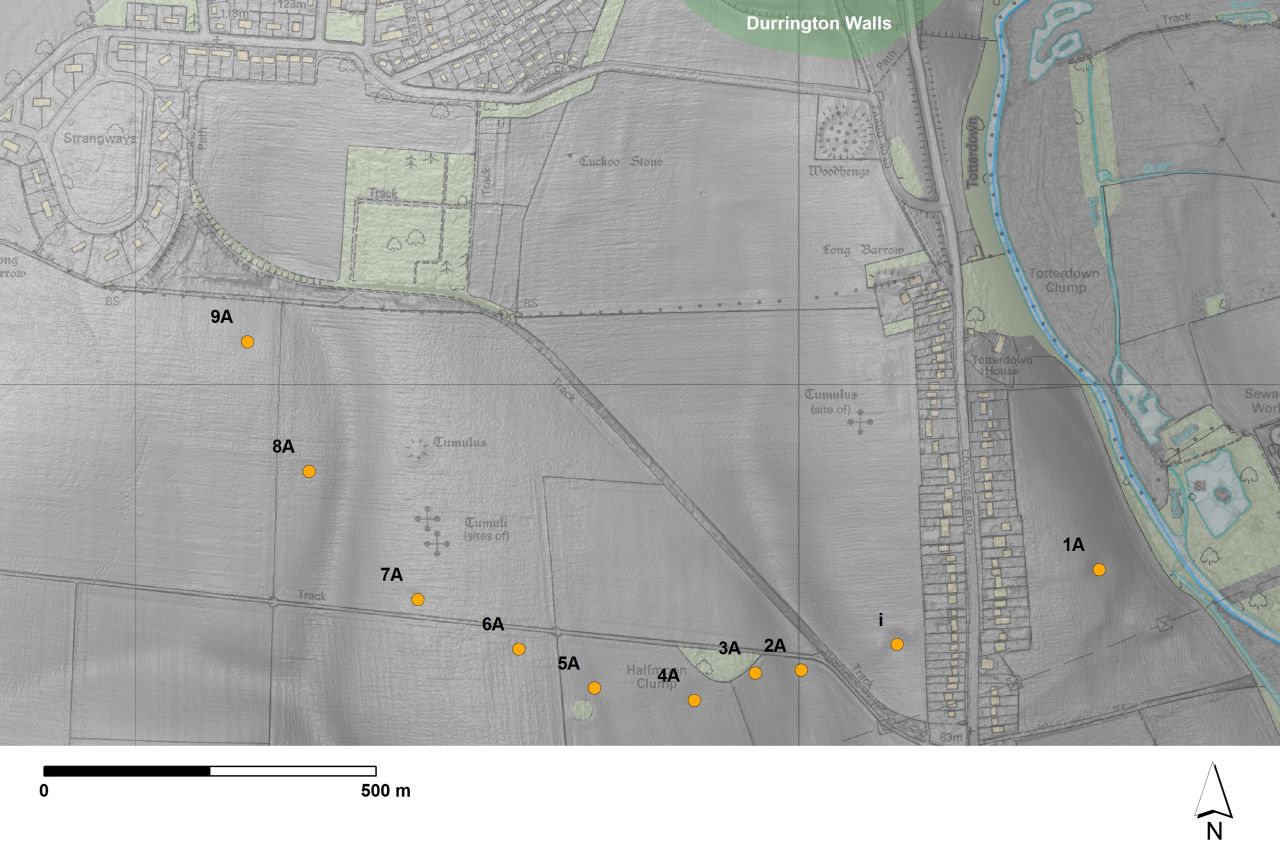
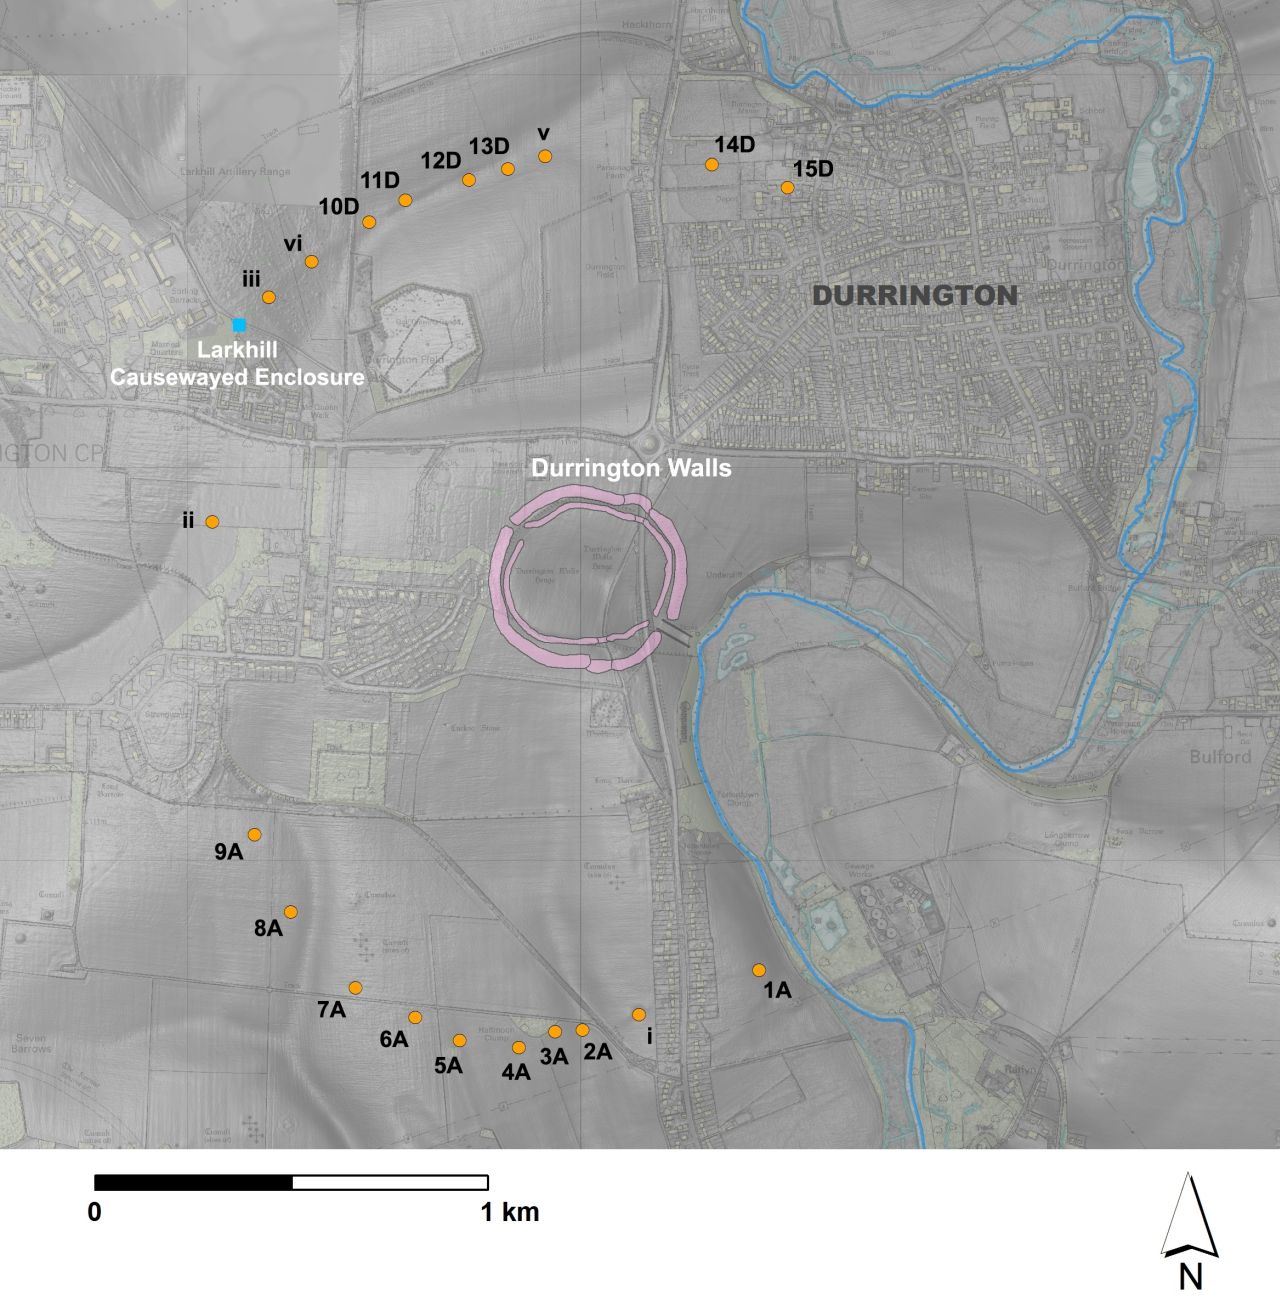
An example of such a process can be provided through the recent identification of a series of massive pits located near the henge at Durrington Walls. Here, nine similarly sized, circular magnetic anomalies (1A-9A on Figure 2), were mapped by the SHLP to the south of the Durrington Walls Henge over two seasons in 2012–13. Inspection of the data revealed that these anomalies were arranged across a broad arc measuring over 1.5km from the River Avon in the east, to Strangways in the west, via Half Moon Clump on Countess Farm (Figure 2). Each anomaly comprises a disc of enhanced magnetic readings, 15-20m in diameter, and surrounded by a slightly less magnetic 'halo'. An additional feature i, not illustrated in Figure 2, is tentatively included within this group on the basis of its comparable shape and position within the line of the arc. It is, however, situated in an area of strong magnetic disturbance associated with a historic, light military railway, and the response may result from metallic debris filling a surface depression that is comparable to those features identified within the magnetic data.
Four of the ten anomalies (4A, 6A, 7A and 9A) coincide in part with aerial photographic transcripts published by the National Mapping Programme (Crutchley 2002). Three of these (4A, 6A, and 9A) were scheduled as the remains of levelled round barrows. Two of the group (4A and 6A), were documented as sites A151 and A146 respectively by the RCHME in their 1979 gazetteer. None of these features were documented by Grinsell (1957). The remaining six anomalies (1A, i, 2A, 5A, 8A and 3A) were not previously recorded or identified as archaeological features. See Feature Gazetteer.
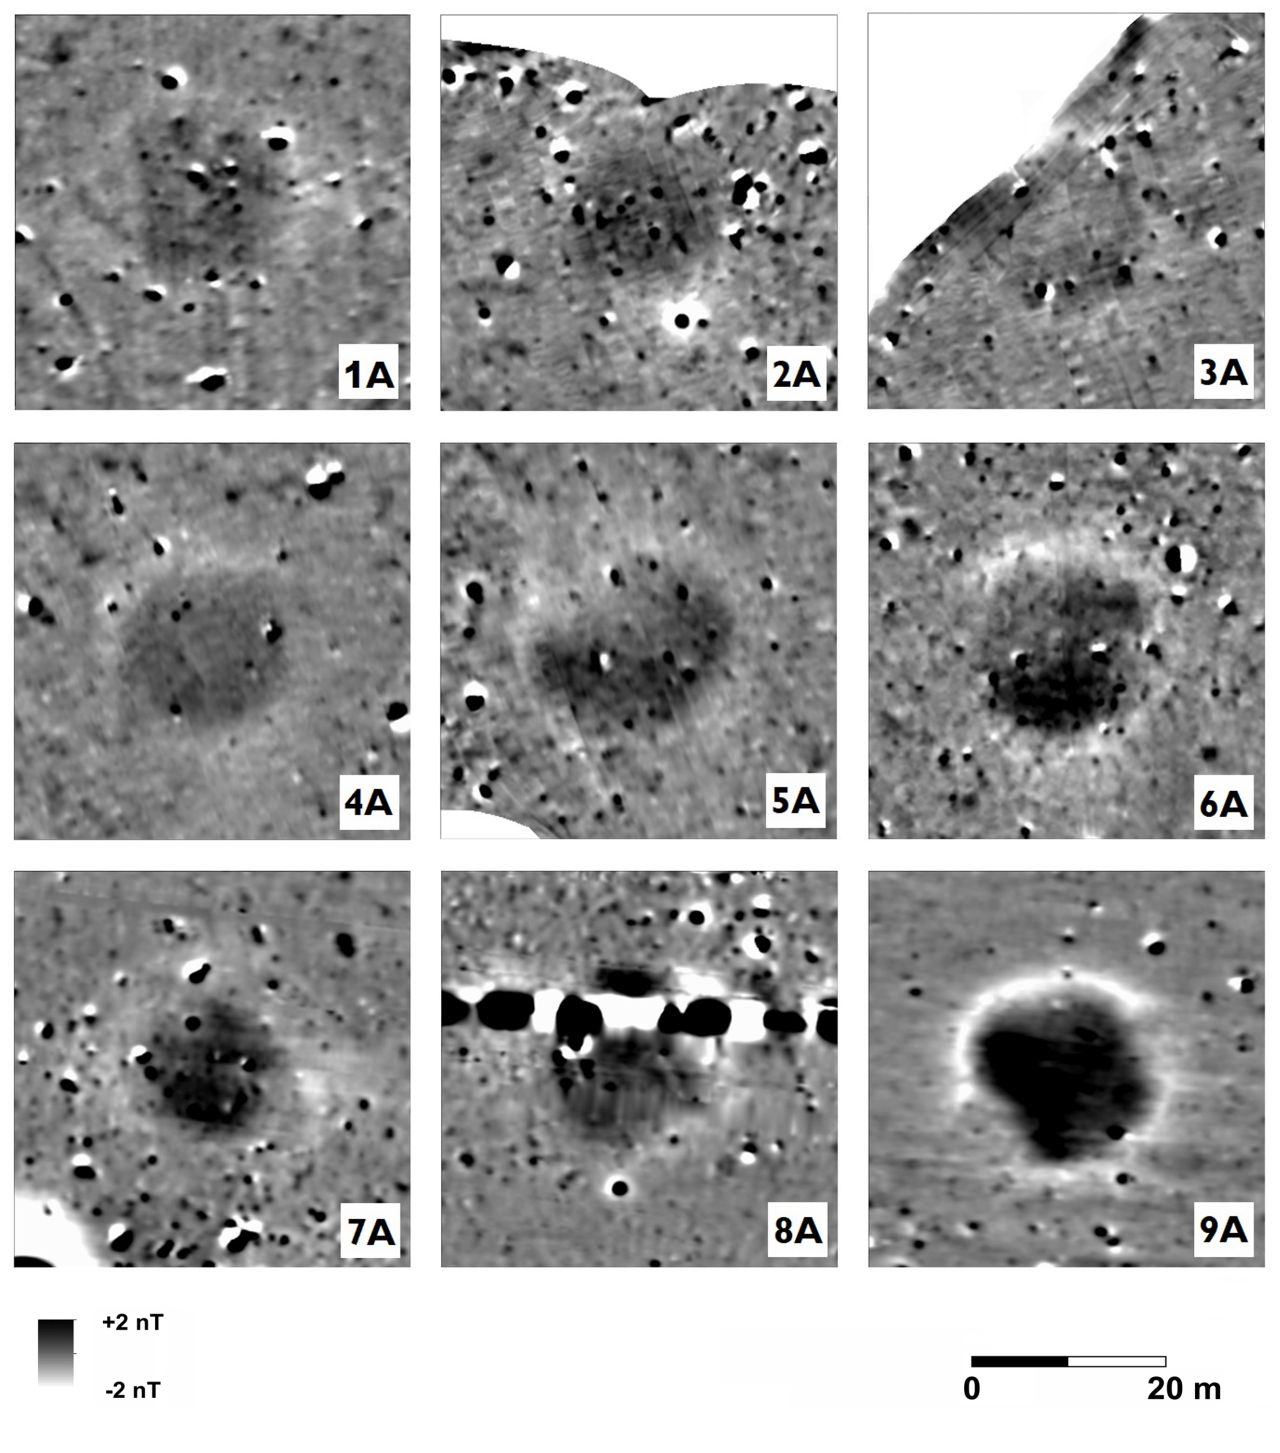
The uniformity of response, size, shape and alignment within the group is noteworthy and suggest all ten belong to an associated endeavour on a large scale. Consistent in character, these features, which appeared to be relatively shallow, were initially interpreted as dewponds (Hubbard and Hubbard 1916). Another possibility, considering the concentration of army and air force installations in the area, was that they may have been associated with (temporary) utilities or even dug features excavated during military training.
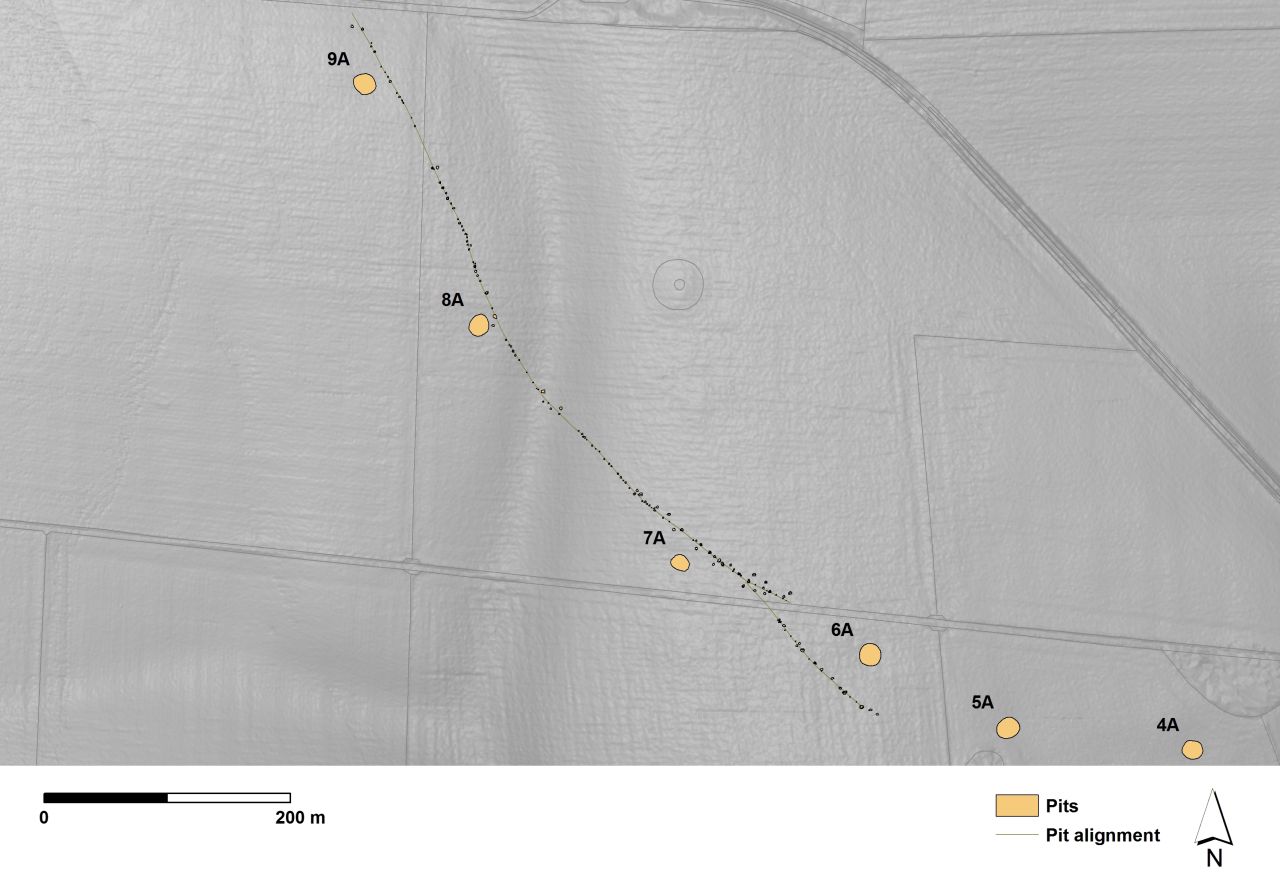
A separate set of, potentially, related features is associated with these large anomalies (Figure 4). An alignment of smaller posts/pits runs parallel to features 6A to 9A. These terminate to the north in woodland and to the south-east where the alignment enters solifluction deposits, frequently referred to as 'Head', where soil conditions may not permit detection of these smaller features.
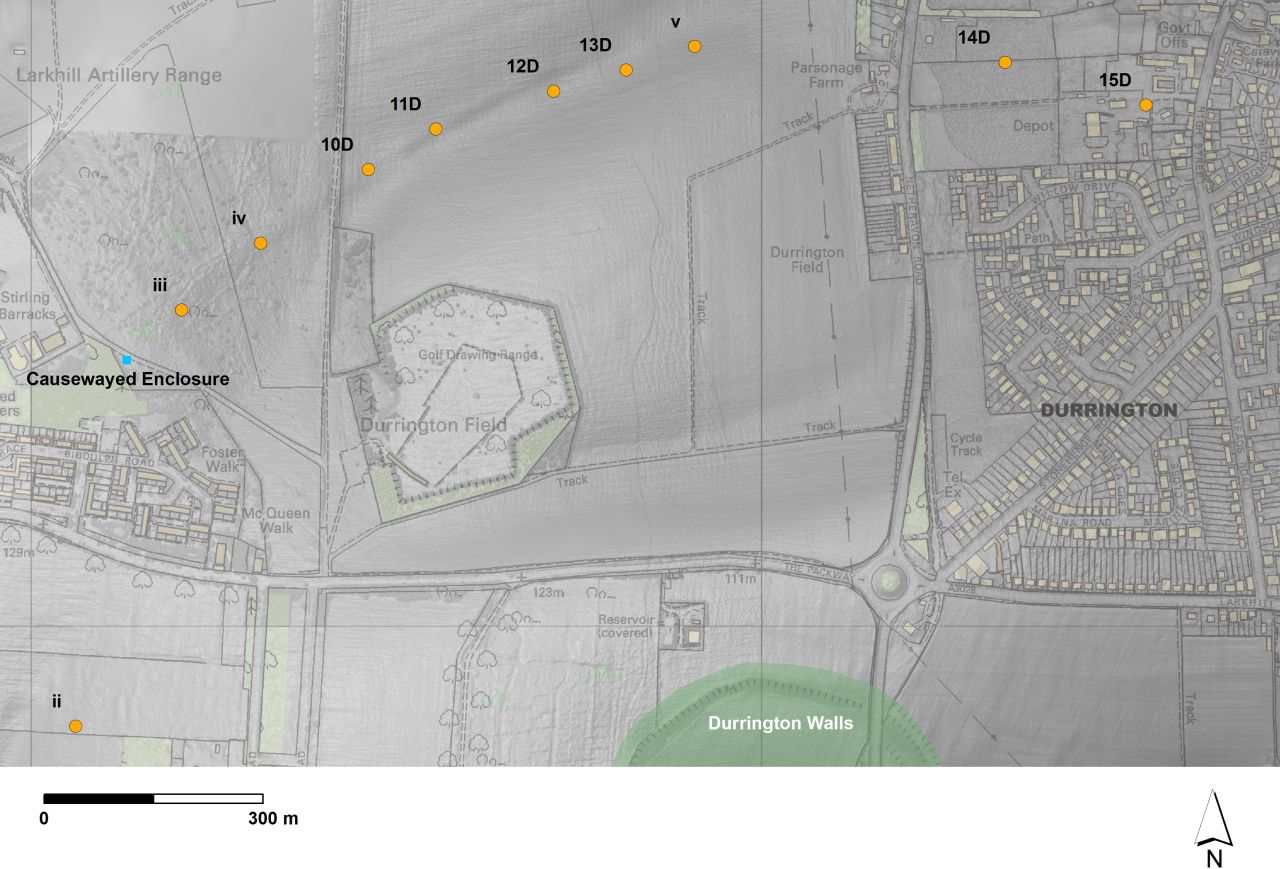
The significance of these features was enhanced following the location, by Wessex Archaeology, of six features of similar size and character north of Durrington Walls, and labelled as 10D–15D in Figures 5 and 6 (Thompson and Powell 2018; Urmston 2014; Schmidt and Crabb 2017). Four features, 10D to13D, were mapped through geophysical survey at Larkhill (East Site) and generated responses of similar size and character to those found south of Durrington (Figures 5-7). Feature 10D equates with magnetic anomaly 4008 in Urmston's 2014 survey. This was partially excavated by Leivers and Thompson (2015) when the feature was identified as a sinkhole, and a machine slot was excavated to a depth of 2m across the hollow. Middle Bronze Age ceramics were recovered from this feature (Leivers and Thomson 2015, 12). 12D equates to magnetic anomaly 4006 as mapped by Urmston (2014, 3) and as magnetic anomaly 6015 by Schmidt and Crabb (2017, 9). 13D was mapped by Schmidt and Crabb (2017) as magnetic anomaly 6016. Both of these features were interpreted to indicate the presence of a solution hollow on the basis of the similarity of magnetic response and the results of partial excavation.
Feature 11D is more complex. This feature was mapped by Urmston (2014) and Schmidt and Crabb (2017) as magnetic anomalies 4007 and 6014 respectively, and also interpreted as a solution feature comparable to 10D and 12D. The anomaly was also trenched by Leivers and Thompson (2015) as feature 11207, in trench 112. This records that the feature was 'at least 18m in diameter and over 1.5m deep [2.7 metres below current ground surface]: the base of the sinkhole was not revealed due to health and safety concerns. The feature had a moderately steep (c.40°) edge and was filled with a homogenous loose pale yellow brown silty clay.' (Leivers and Thompson 2015, 12 and 66). The presence of Bronze Age ceramics is also noted from within this feature (Schmidt and Crabb 2017, 4; Leivers and Thompson 2015, 11-12).
A later watching brief, carried out in advance of laying a pipe, did not record this feature, although the narrow trench should have clipped it (Randall 2017). The report for this work suggested that any magnetic enhancement might have resulted from relatively ephemeral spreads of more magnetic material or attributable to disturbance from tree/shrub roots and rabbits. While the capacity for topsoil to retain spatial foci of enhanced magnetic susceptibility associated with ephemeral spreads of material is known elsewhere, the contrasting results between these reports is significant. Mechanisms that invoke 'disturbance' must lead to the question of where the enhanced material originates from. In this case, considering the form and strength of the gradiometer responses, it is apparent that the results are entirely consistent with an induced signal from significant cut features rather than a thin spread of topsoil-dispersed material (Aspinall et al. 2008, 72). The origin of the magnetic results is highly suggestive of an anthropogenically enhanced soil. However, given the description of the substantial feature revealed by the initial trial trench, and the results of excavation of similar anomalies at features 10D, 14D and 15D (Leivers and Thompson 2015; Thompson and Powell 2018), it may be considered that this narrow trench did not actually cross the feature recorded by Wessex Archaeology.

Features 14D (feature 6257 in Area 1) and 15D (feature 6513 in Area 4) were partially excavated at the site of the former Ministry of Defence Headquarters building in Durrington (Figures 6 and 7; Thompson and Powell 2018, 40-41). Feature 14D also produced an early Middle Bronze Age date of 1690–1520 cal BC (95% probability; SUERC-50628, 3327±31 BP). Although neither feature was bottomed, both were believed to have narrower central [solution] shafts. 14D (feature 6257) was excavated to 3.1m depth where its shaft was presumed to contain natural sediments (Thompson and Powell 2018, 15-16). 15D (feature 6513) was only excavated to 1.2m depth, although its (assumed) central shaft was machine-augered to a depth of 6m (Thompson and Powell 2018, 40-41).
Two intersecting post-hole alignments were also located south of features 14D and 15D. One of these alignments comprised 16 post-holes; irregularly spaced and between 4.8m and 27m apart. These were recorded by the excavators over a distance of 240m, and probably continued east and west beyond the excavation trench (Thompson and Powell 2018, fig.3.1). Radiocarbon dates from these features provided a construction date for the post alignments between 2670–2550 cal BC (87% probability; earliest sapwood) and a date for the decommissioning of the alignments within the range of 2575–2470 cal BC (at 95% probability; earliest bone; Thompson and Powell 2018, 111).
A further alignment of 17 post-holes of varying sizes was recorded over some 260m, south of the line of large pits 11D to 13D (Leivers et al 2020). It consisted of three groups of features separated by unexcavated baulks. The only readily datable material recovered from these features was Late Neolithic/Early Bronze Age pottery from one feature. The entire group is, however, considered likely to be of Late Neolithic date based upon a presumed connection with a similarly aligned group of post-holes at the former MoD Headquarters at Durrington which - if projected westwards - could feasibly join to this group.
It should be emphasised that surveyors and excavators certainly appreciated the probable archaeological value of these features and noted the general integrity of this group in terms of dimensions and alignment (Leivers and Thompson 2015, 12). Urmston, when discussing three of the pits surveyed (10D, 11D and 12D), commented that 'the three large circular anomalies are pit-like in character and may therefore represent infilled hollows or pits. The general lack of ferrous responses in conjunction with these anomalies suggests that they were not infilled recently, as modern and historic debris tends to contain magnetic components to some degree, supporting an archaeological interpretation' (2014, 5). The general presumption, therefore, in respect of this group of features was that, while the features were certainly associated with significant archaeological deposits and activity, they were likely to be of natural origin and probably related to a series of solution features following the dry valley.

In addition to those features identified through excavation or geophysics is a smaller group associated more generally on the basis of a similarity in shape and dimensions. Feature ii, noted during the National Mapping Programme, is circular and measures c. 18m in diameter (Crutchley 2002). Interpreted as a circular bank, the recorded outline coincides with surface variation noticeable in the Environment Agency lidar data (Figure 7). Aside from its position on the projected line between the southern and northern arcs, similar crop mark characteristics were identified by the National Mapping Programme on or near geophysical anomalies 4A, 6A, 7A and 9A.
Two other features, iii and iv, were originally marked on the planning constraints map for the Army Basing plan at Larkhill (DIO 2017, 20; Daw 2018). These circular/ovoid features were identified following an area strip and fluxgate gradiometer survey. This suggested maximum dimensions of 19m and c. 22m respectively and are variably portrayed in planning documents. Unexcavated, they demonstrate a strong similarity, in dimensions and shape, to features 10D to 15D, and are also on the alignment of a larger group of features as the newly discovered Larkhill Causewayed enclosure is approached. Features 10D and 11D are identified on the same plans as sink holes/soft patches.
A distinctive circular crop mark, marked v on Figure 7, identified by Paul Garwood in 2018, was located in open fields between Wessex Archaeology sites at Larkhill and Durrington. This feature is included here as, potentially, a fifth related feature on the basis of its similarity in size and form to excavated features north of Durrington, and its relationship to the arc of known features to the north of Durrington.
That general presumption that the group of features north of Durrington Walls were natural in origin and, probably, solution features gains some support in the geological literature. Such features are relatively common on the chalk and the available mapping is likely to provide an underestimate of their actual distribution (Hopson et al. 2006, 215). Some of the features recorded north of Durrington are set within a slight valley trending west-east towards the Avon. While such a topographic situation can provide the conditions that can lead to the development of solution features, the southern group of anomalies does not align with any similar topographic feature, and actually crosses higher ground above dry valleys. Consequently, the origins of the southern group of anomalies as solution features or doline is less likely.
Taken together, the features mapped by Wessex, the SHLP, and those located from aerial photography, form a consistent group in terms of their size and character. When these two groups of features are combined, they also appear, visually, to form a partial, concentric ring around the henge at Durrington Walls measuring more than 2km in diameter (Figure 8). Unfortunately, substantial areas of the landscape to the west and east of these features have been developed and are no longer available for prospection. The opportunities to survey these areas and to confirm whether these arcs are components of a single, larger structure centred on Durrington Walls is therefore limited.
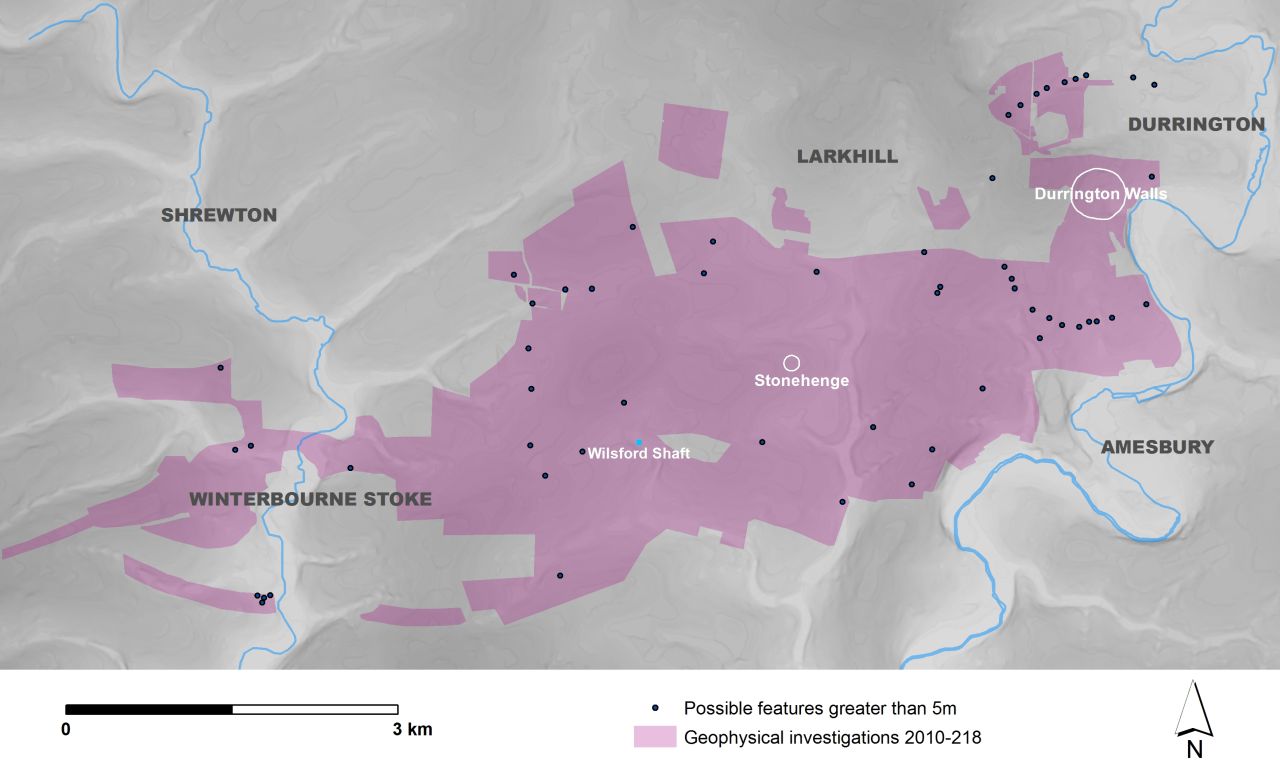
The unique nature of those features, identified through geophysical survey, is apparent when one considers that the area around Stonehenge and Durrington is now one of the most extensively surveyed archaeological landscapes in Britain. Some 18.4km² of landscape has been subject to geophysical survey for archaeological purposes over many years (Figure 9). There are a number of substantial pit-like anomalies within these datasets, including individual features that may be comparable in size to the Durrington pits and which have also been interpreted as solution features (Highways Agency 2019a, 5.1.9; 2019b, 203). Despite this, no comparable group of features have been reported from this extensive dataset, and currently the alignment of features at Durrington is unique. The character and significance of the remaining features, and their distribution, awaits detailed investigation.
There is another important characteristic of these features. The northern group appears to align on the recently discovered Larkhill causewayed enclosure (Figure 8; Leivers 2017). Provisional reports indicate that seven excavated ditch segments from that site may have formed part of a circuit of pits measuring c. 210m in diameter, and approximately the same size as Robin Hood's Ball; a causewayed enclosure some 2.5km to the west. Calibrated radiocarbon results reported in Leivers (2017, 12) indicate cattle bone from the base of one ditch segment dates to 3780–3650 cal BC while a line of six large post-holes, running roughly south-west to north-east, cut the enclosure and provided a date of 2480–2290 cal BC. The orientation of these posts was recorded as having a best-fit azimuth of 49.5°, close to the direction of the midsummer solstitial sunrise (C. Ruggles and A. Chadburn pers. comm.).
Taken together, the similarity of the recorded group of features, and their spatial pattern, suggested that further examination of the group was required.
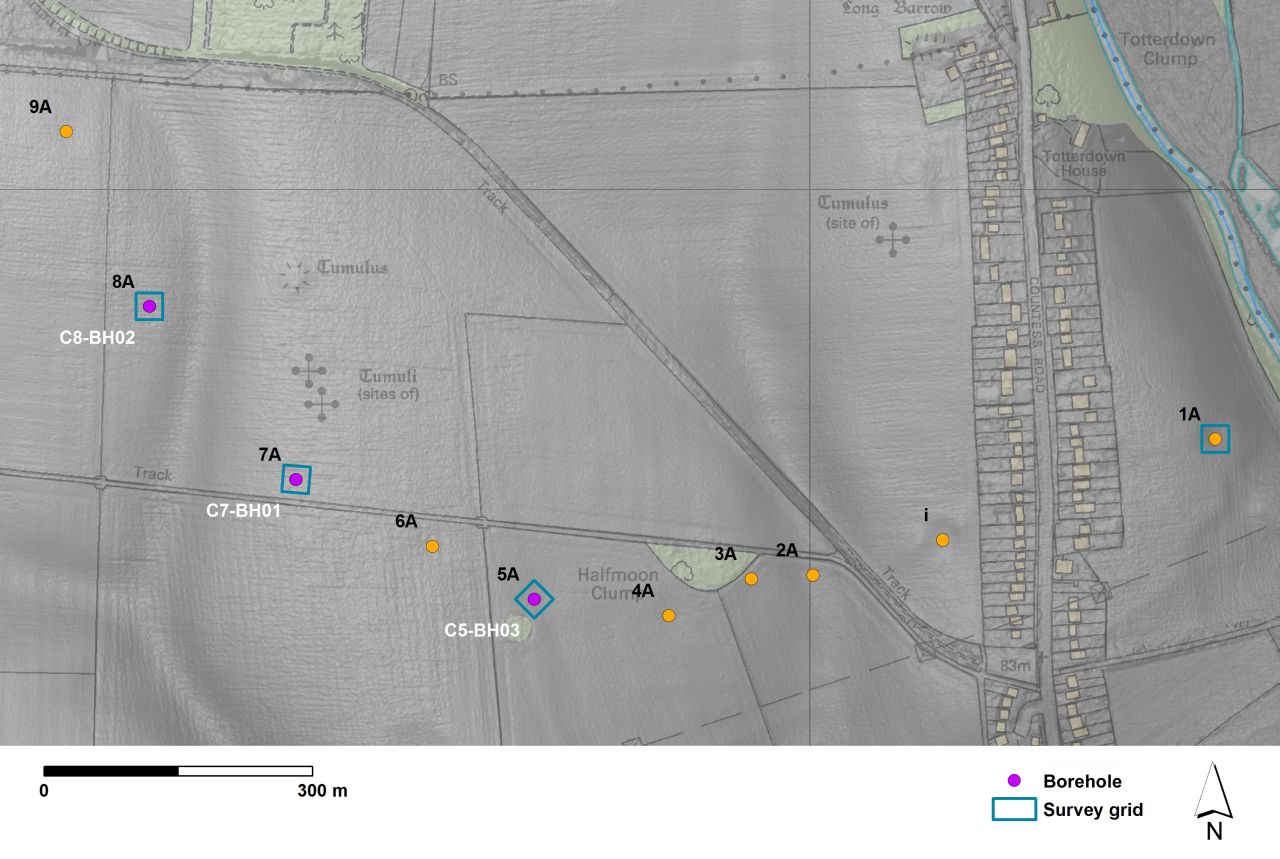
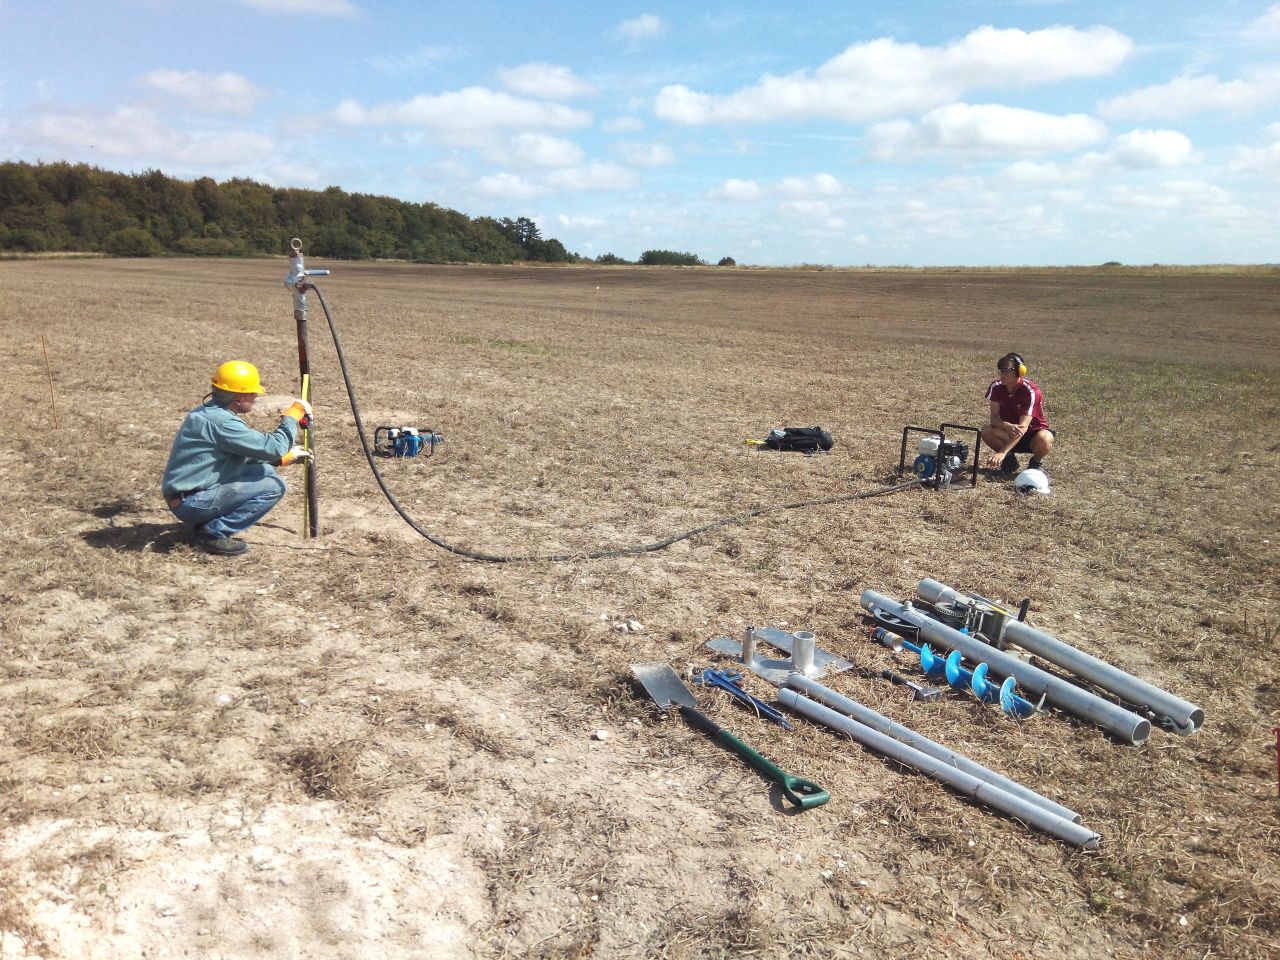
The decision to investigate these features further was supported by the University of Bradford research fund and carried out during August 2019 by a team of researchers from the Universities of Bradford, St Andrews, Warwick and Birmingham. This allowed detailed and partial survey of three features - 1A, 7A and 8A (Figure 10; see data file 2 and data file 3 for details of the results of fieldwork). Ground penetrating radar survey, using 250 and 500 MHz antennae, was undertaken as well as an electromagnetic conductivity survey carried out over and around 7A and 8A using a GF instruments CMD Explorer. The extremely dry conditions during survey meant that attempts to core the features with a Winkie vibracorer (Wink Vibracore Drill Company Ltd) were not successful (Figure 11). Consequently, following the provision of further assistance from the University of Bradford, a second field season was undertaken during October 2019. On this occasion, further survey was carried out over features 7A and 5A, and a large, Dando Terrier percussive corer hired for the purposes of coring through three features (5A, 7A and 8A, Figure 12).

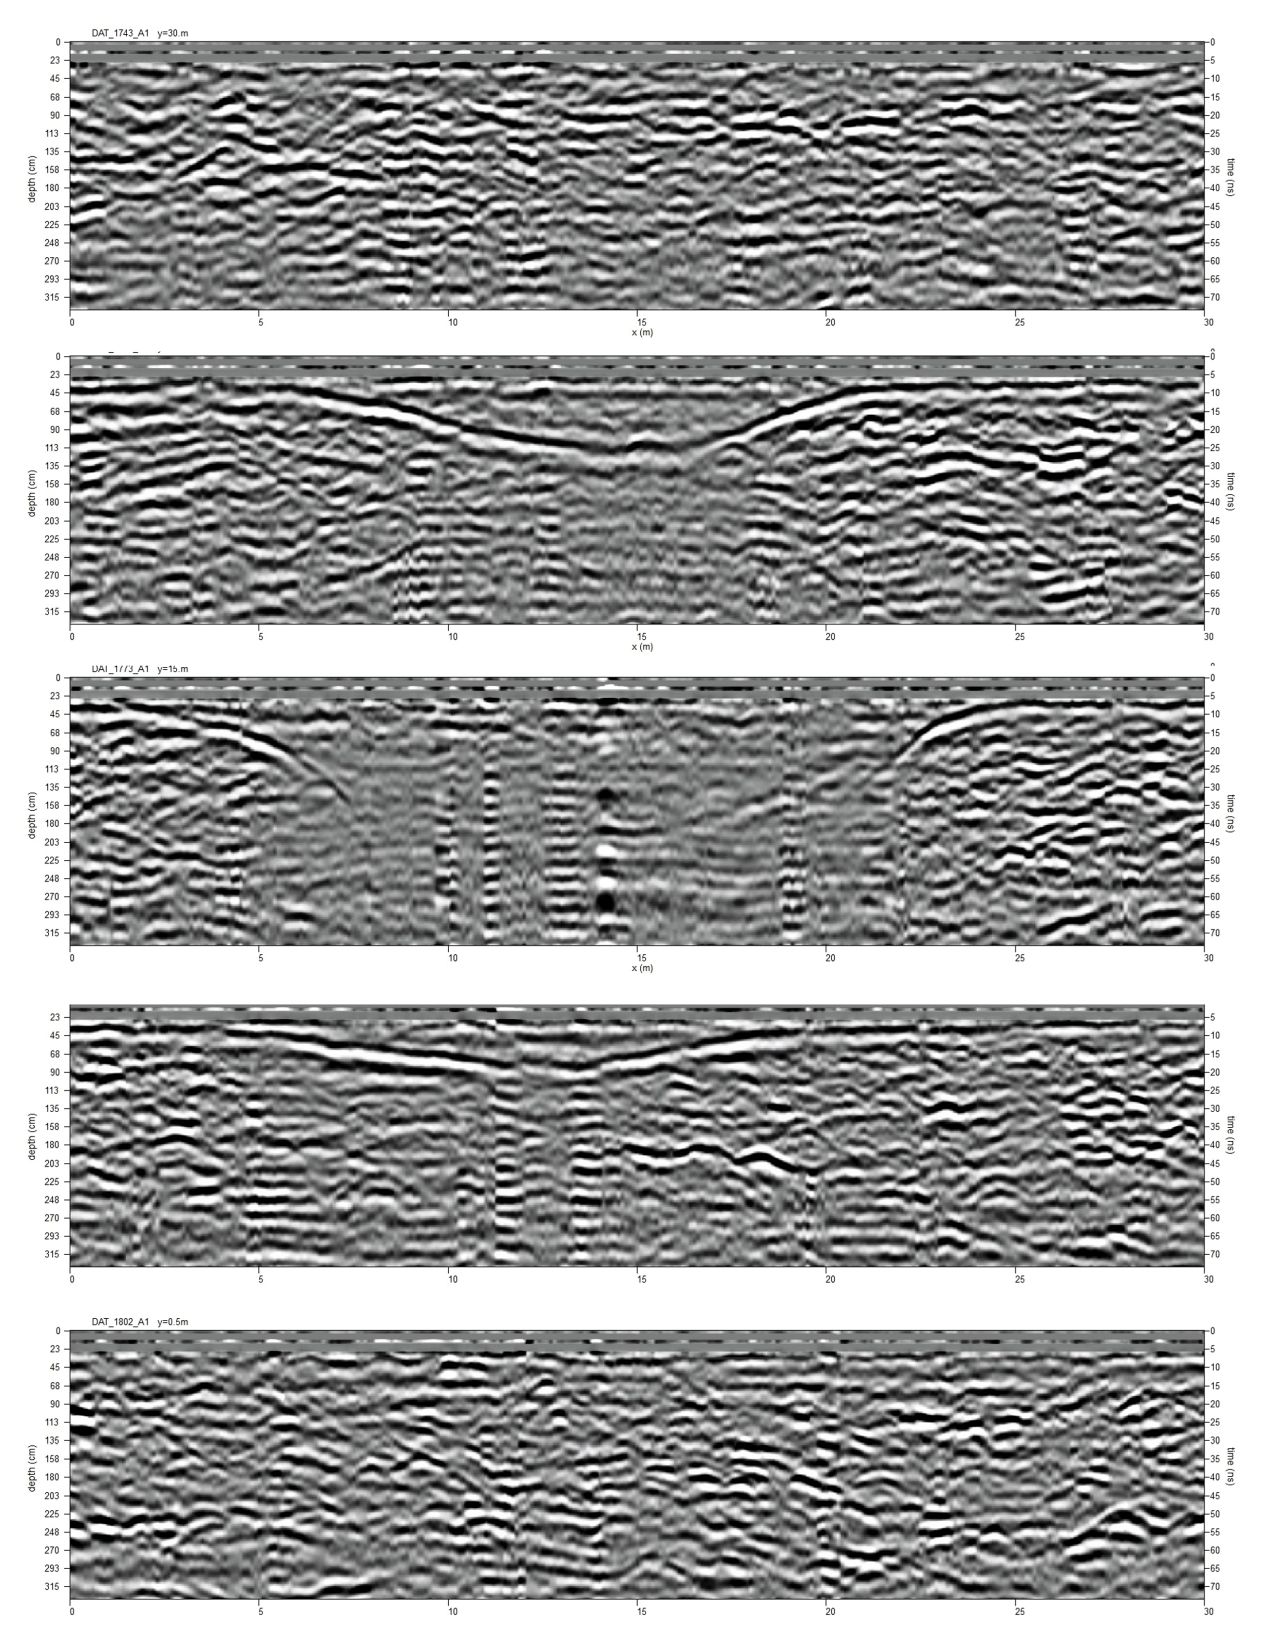
Profiles from ground penetrating radar indicated that, far from being shallow features, as had been expected if these anomalies originated as dewponds, the surveyed features had quite dramatic vertical sides. The large surface diameter of the features appeared to represent the effect of weathering cones and, where measurement was possible, the actual diameter of these features may have been half, or less, than the surface measurement.
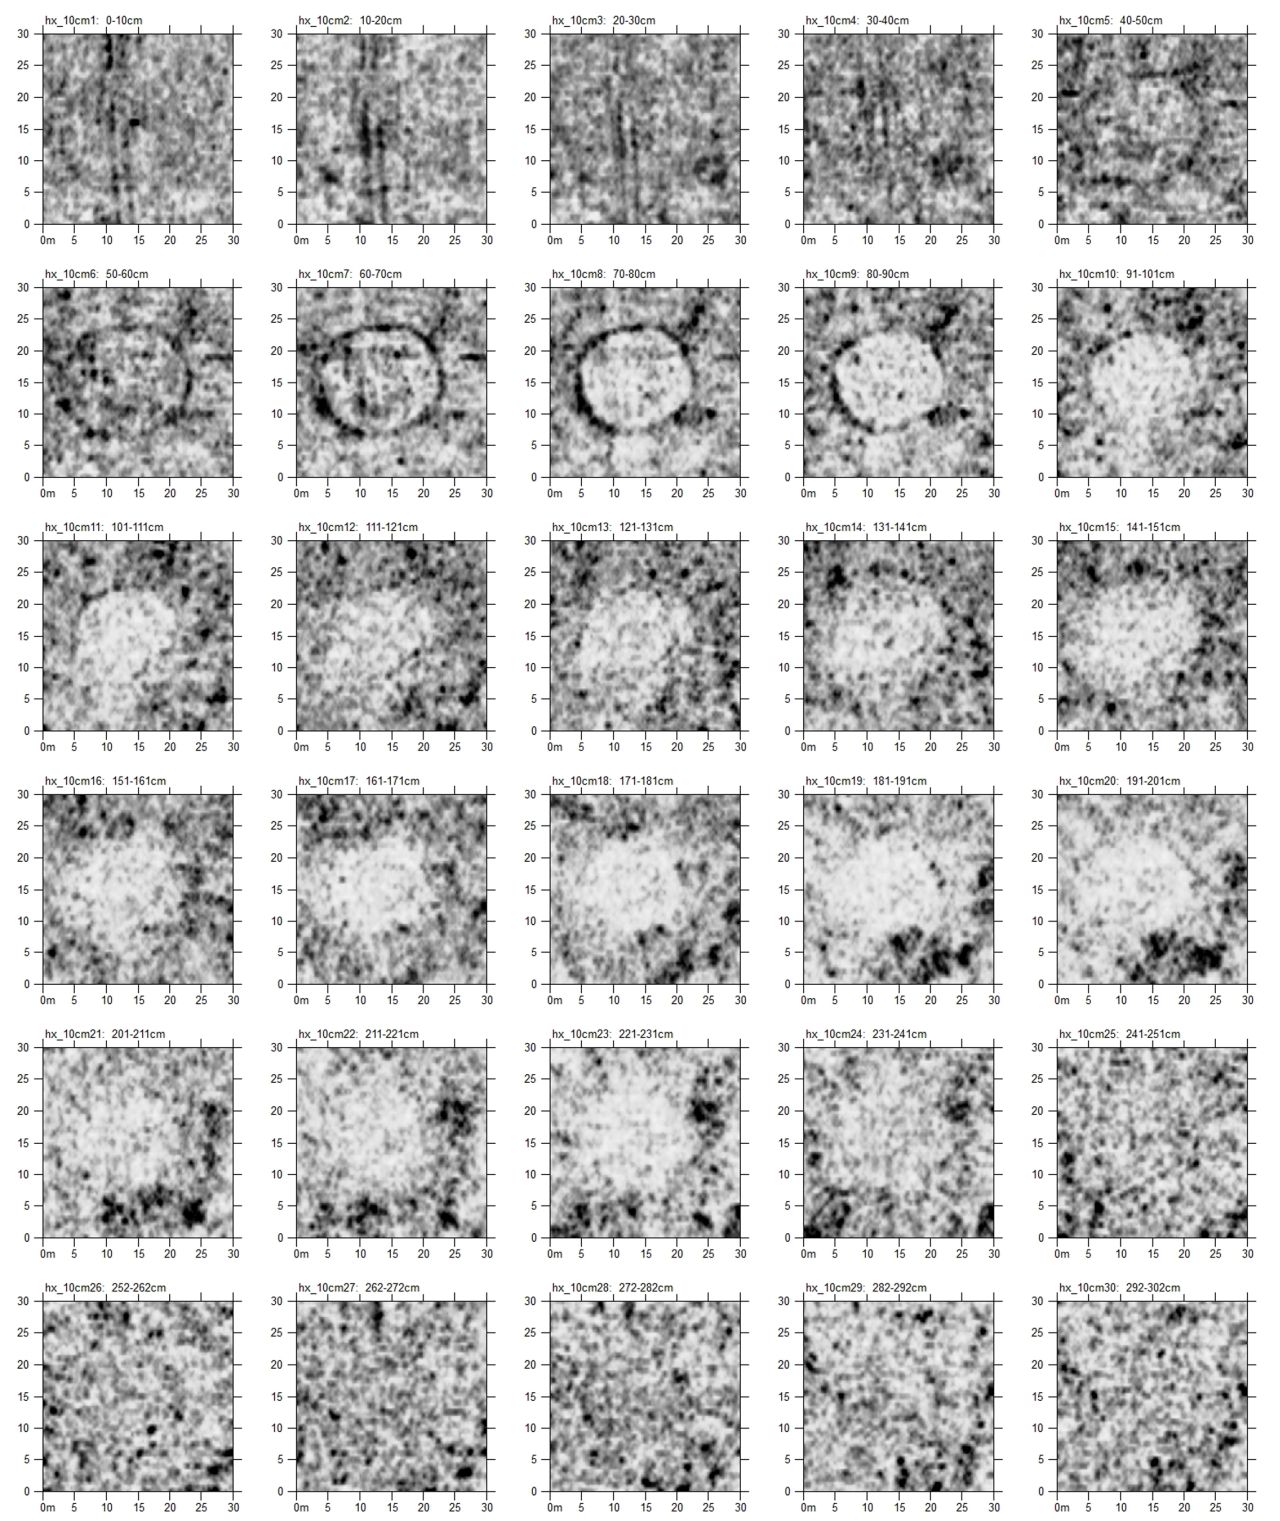
Radar profiles and time slices illustrate that the edges of features 8A could be traced to a depth of c. 3m – although the base of this feature could not be resolved (Figures 13 and 14). A similar profile was suggested for 7A, although the data did not provide as clear an image as for 5A. Full details of these surveys are also contained within the supplementary data file 2.
Following survey, features 5A, 7A and 8A were cored to assess the stratigraphy of the features and to assess whether they may have been the result of natural processes (supplementary data file 4). Cores from features 7A and 8A reached bedrock at a depth of c. 4.8m (Figures 15 and 16). The apparent consistency of this measurement across these pits might usefully be compared to the average depth of the ditch at the Durrington Walls henge, which also averaged 4.8m (Wainwright and Longworth 1971, 196). However, the base of 5A was not identified visually and the feature was cored to a depth of 7m. Both 7A and 8A were broadly similar, with upper fills characterised by yellowish-brown clay silts and chalk-rich silts. The lower layers have variously unconsolidated clay silts within chalk and flint clasts. 8A provided bone fragments and a struck flint in its lower layers between 4.65m to 4.76m. The base of both features was sharply defined and characterised by white fractured chalk bedrock.
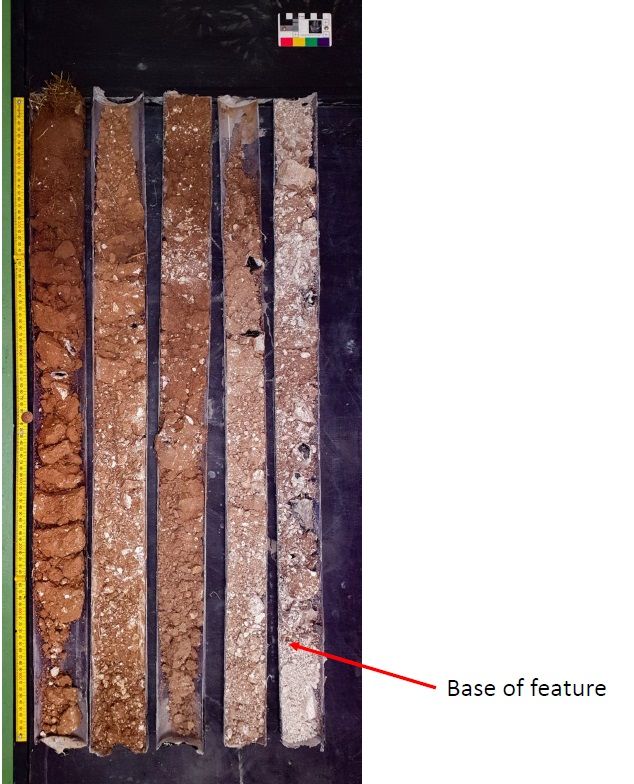
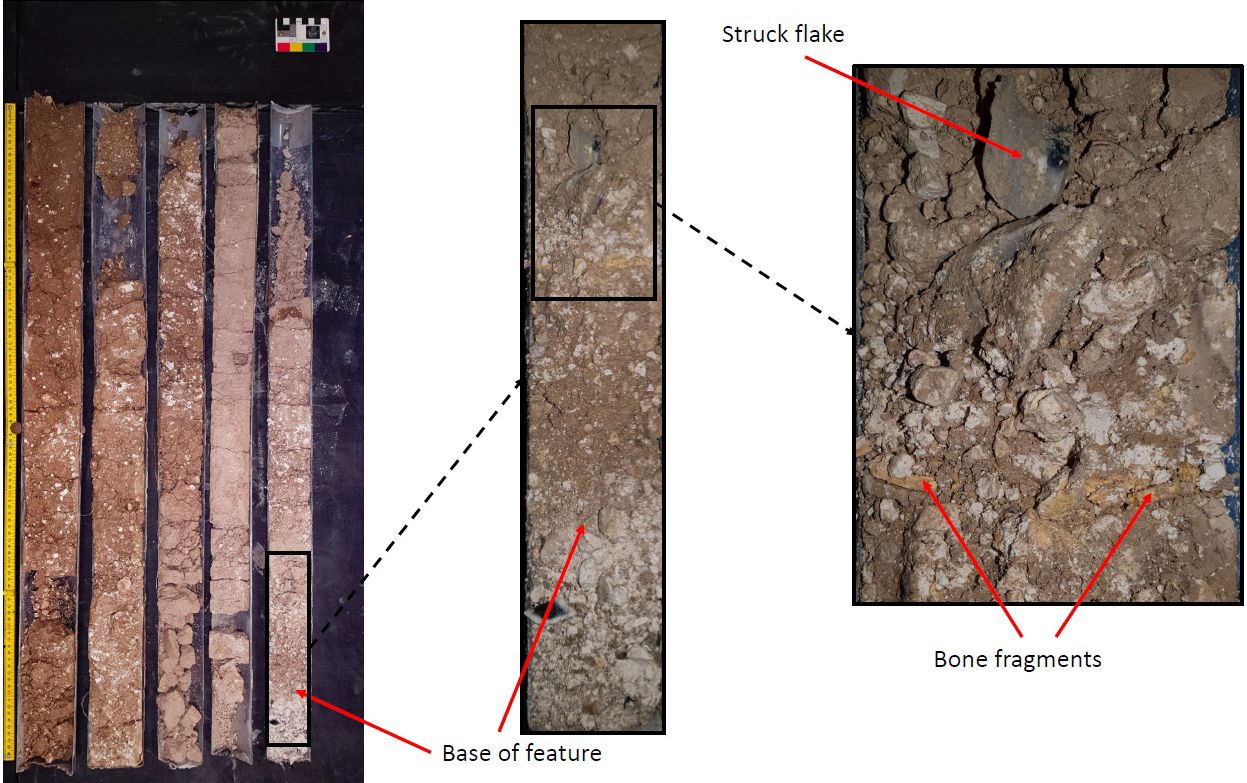
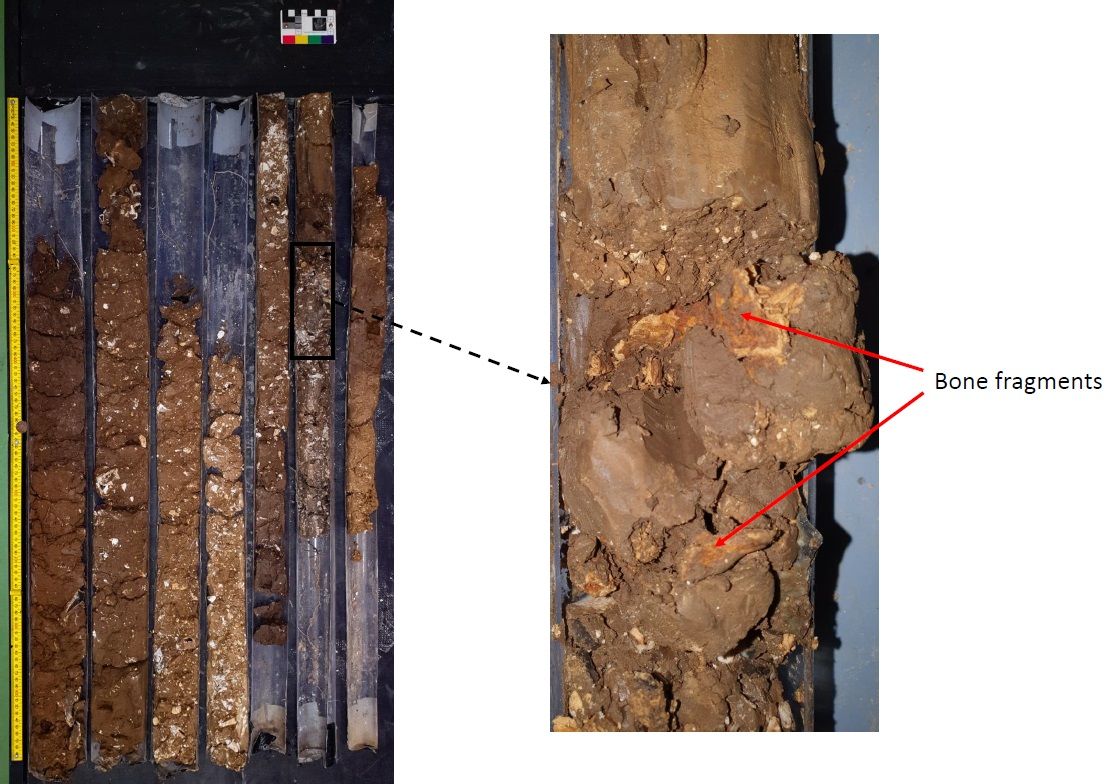
Feature 5A provided a significantly different profile, comprising reddish-brown, yellowish-brown and brown clay silts including occasional flint and clay clasts (Figure 17). There were charcoal and bone fragments throughout the sediments between 4.5m to c. 5.25m. The core was fragmentary between 5.25m to 6m and, below this significant break, the sediments were characterised by firm and cohesive, yellowish-brown clay silts with small chalk clasts. These were bedded with very weakly defined darker brown horizons. Neither visual inspection of the core, nor radar data, could provide certain evidence for a base to this feature. Geologically, this pit sits within an area mapped by the British Geological Survey as containing 'Head', a solifluction deposit that locally can achieve thicknesses of up to 6m, and it is likely that the feature is cut into these sediments (Figure 18).

Samples were also extracted for an ongoing environmental study at the University of Warwick as the age and environment of these deposits is compatible with the preservation of ancient DNA (Kistler et al. 2017). With the improvement of stratigraphic integrity tests developed at Warwick (Gaffney et al. 2019) there is an opportunity to test the environmental composition and extent of DNA movement within each of the cores, a particular concern in terrestrial sedimentary systems (Haile et al. 2007). The sedimentary ancient DNA (sedaDNA) profiles may then be used to distinguish late glacial background features and subsequent sequential cuts into the anomalies and their associated palaeoenvironmental reconstructions. Such data may help to throw light on the nature and context of the anomalies. The results of this study will be reported elsewhere.
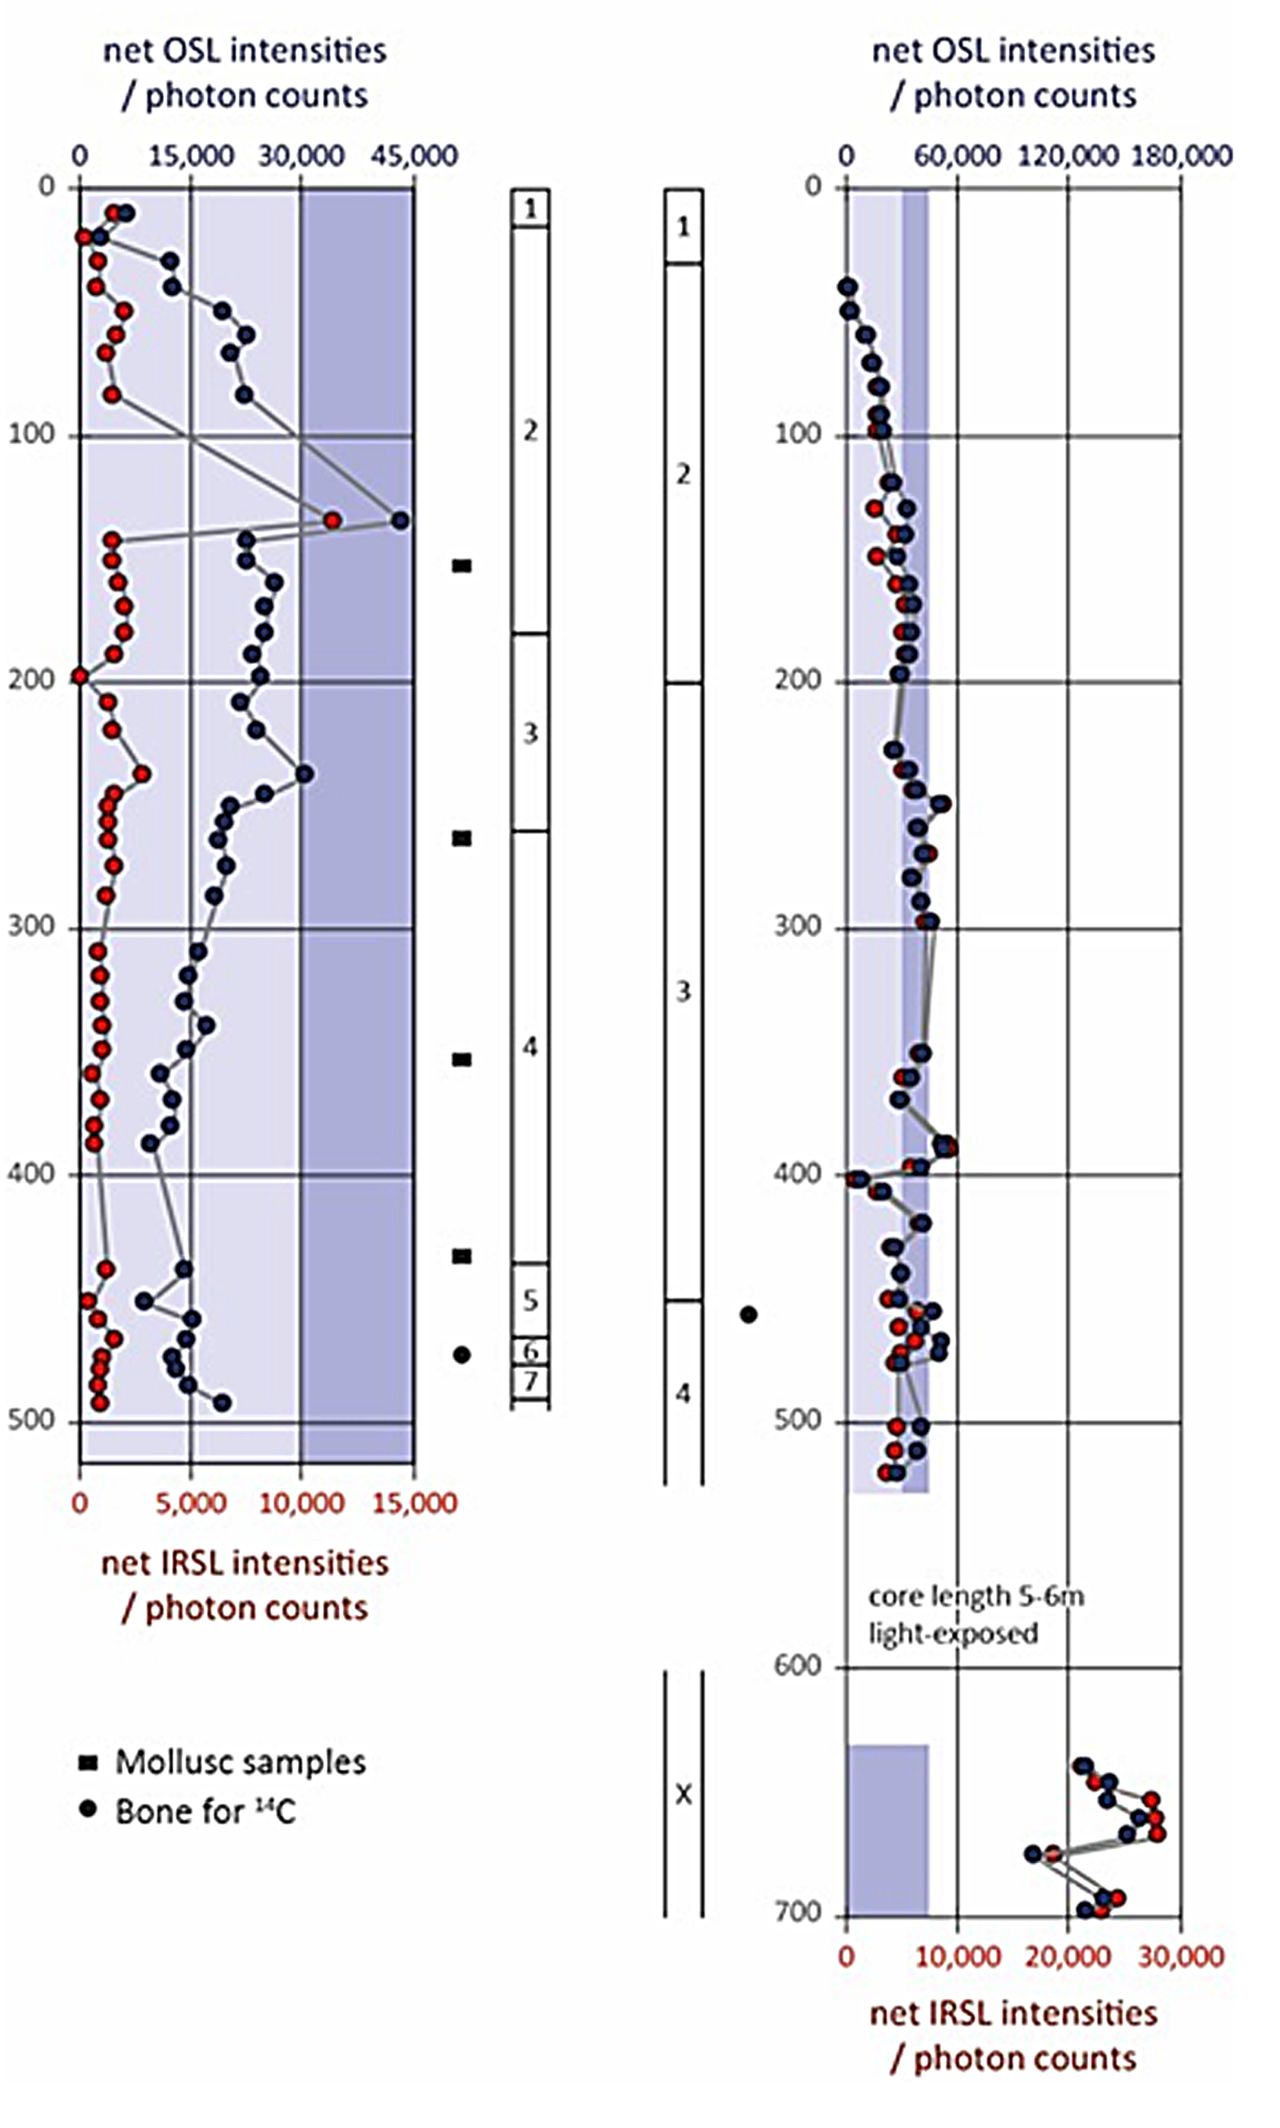
Luminescence stratigraphy was generated for the sediments recovered in cores 8A and 5A (Figure 19; and supplementary data file 5). IRSL and OSL net signal intensities, IRSL and OSL depletion indices and IRSL:OSL ratios were calculated for samples collected at regular intervals down the core (10cm), with tighter resolution sampling around the sedimentological boundaries. The luminescence proxies are shown relative to depth in Figure 19 and are tabulated in the supplementary data file 5.
In 8A, signal intensities increase with depth through the interval 20 to 135cm, implying a gradual accumulation of sediment; yet, from 135cm to 452cm, signal intensities decrease with depth, suggesting that these materials are re-deposited. The radiocarbon evidence discussed below corroborates this. In contrast, in 5A, signal intensities increase with depth through 40 to 351cm, fluctuate around a central tendency from 351 to 521cm, before a substantial shift to higher signal intensities between 521 and 640cm (the core length between 521 and 640cm was light-exposed, so not sampled for OSL). The shift in signal intensities across a dynamic range of 3 to 4 implies a substantial chronology to deposition of the lower units. The implications of this for sediment accumulation in 5A is that the upper unit accumulated gradually over time (40-351cm), then age-related accumulation of rapidly deposited sediments (351-521cm) occurred, with either a clear stratigraphic break between 521 and 640cm, or a prolonged chronology to deposition of sediment between 521 and 640cm.
More regionally, the magnitude and range in signal intensities between features 8A and 5A, implies that these sediments have experienced different depositional histories, with the quartz and/or feldspar dosimeters sourced from different provenances, or experienced different depositional pathways.
The presence of shell or bone within all three of the cored features provided material sufficient for five radiocarbon dates from across all three pits (supplementary data file 6). The samples were submitted to the Scottish Universities Environmental Research Centre (SUERC) for analysis (Dunbar et al. 2016). The results are presented in Table 1 as conventional radiocarbon ages (Stuiver and Polach 1977) and have been calibrated using the OxCal program (Bronk Ramsey 2009) and the internationally agreed terrestrial calibration curve (IntCal13) of Reimer et al. (2013).
| Lab ID | Feature | Depth (m) | Material | δ13C (‰) | δ15N (‰) | C:N | Radiocarbon age (BP) | Calibrated date (95% probability) |
|---|---|---|---|---|---|---|---|---|
| SUERC-92464 | 7A | 4.80–4.85 | shell | −7.0 | 7179±28 | 6080–5990 cal BC | ||
| SUERC-92465 | 8A | 1.50–1.55 | shell | −6.6 | 5788±28 | 4710–4550 cal BC | ||
| SUERC-92466 | 8A | 4.35–4.40 | shell | −8.1 | 4988±28 | 3930–3870 cal BC (11%) or 3810–3690 cal BC (84%) | ||
| SUERC-92470 | 8A | 4.79 | bone | −22.9 | 4.3 | 3.3 | 3852±28 | 2460–2270 cal BC (78%) or 2260–2200 cal BC (17%) |
| SUERC-92471 | 5A | 5.18 | bone | −21.9 | 5.9 | 3.3 | 3013±28 | 1390–1340 cal BC (13%) or 1310–1160 cal BC (79%) or 1150–1130 cal BC (3%) |
There is a wide range of time represented in the radiocarbon dates. The sequence of three results in 8A are of particular note as there are two radiocarbon results on shell samples and one on a fragment of bone. The sequence shows an inversion between 4.79m and 4.35–4.40m depth, with an even earlier result at 1.50–1.55m. The early dates are on shells and suggest that the determinations from these samples are not reliable and may reflect geological calcium contained within the shells themselves. The dates can, at best, provide a terminus post quem for the surrounding sediments rather than a direct date for the features. The lowest date from 8A was derived from bone sealed within deposits that were slightly above the primary fills and chalk base of the features. This sample was securely stratified and closely associated with a struck flake. The calibrated date of c. 2460–2200 cal BC (SUERC-92470) suggests this feature, at least, dates to the later Neolithic, and by extension provides the best date estimate for the spatially connected feature group. This date suggests that this feature, best interpreted as a pit at this time, was probably open after the ditches at Durrington Walls (2480–2450 cal BC; Darvill et al. 2012, 1036) were dug and perhaps overlapping with Woodhenge (2480–2030 cal BC; 95% confidence; BM-677; 3817±74 BP; Parker Pearson et al. 2007; Darvill et al. 2012, 1036).
The later Middle Bronze Age date from feature 5A, c. 1390–1130 cal. BC (SUERC-92471), is particularly interesting. OSL characterisation suggests that there is a significant difference in age between the deposits dated by 14C and those sediments below 6m. The disparity within the OSL dating may be explained by a later feature cutting into much earlier, and probably natural deposits. However, if this is the case, the anomaly at 5A demonstrates clear similarities in shape and scale to the larger group defined through geophysics and excavation, and tentatively dated through feature 8A to the Late Neolithic.
Consequently, there is a possibility that the core sediments in 5A relate to a recut dated to the Middle Bronze Age. Given the extreme size of the pits described here, and the limitations placed on a methodology restricted to a single core from each feature, we cannot be certain that other pits do not have similar recuts. Several of the excavated features north of Durrington produced Bronze Age material, and 14D produced an early Middle Bronze Age radiocarbon date of 1690–1510 cal BC (95% confidence; SUERC-50628; 3327±31 BP (Thompson and Powell 2018). Currently, we may conjecture that the Middle Bronze Age date from 5A represents a terminus post quem for at least one feature associated with 5A, but there may be earlier phases associated with the pit that have not yet been identified.
A corollary of such an observation is that any of these features might also be associated with deeper natural, or cultural, features. If the former were true, the similarity in dimensions of all the features would still suggest that any natural feature present had been modified and appropriated as part of the larger arc of pits.
In summary, the data provided during fieldwork at Durrington suggest that:
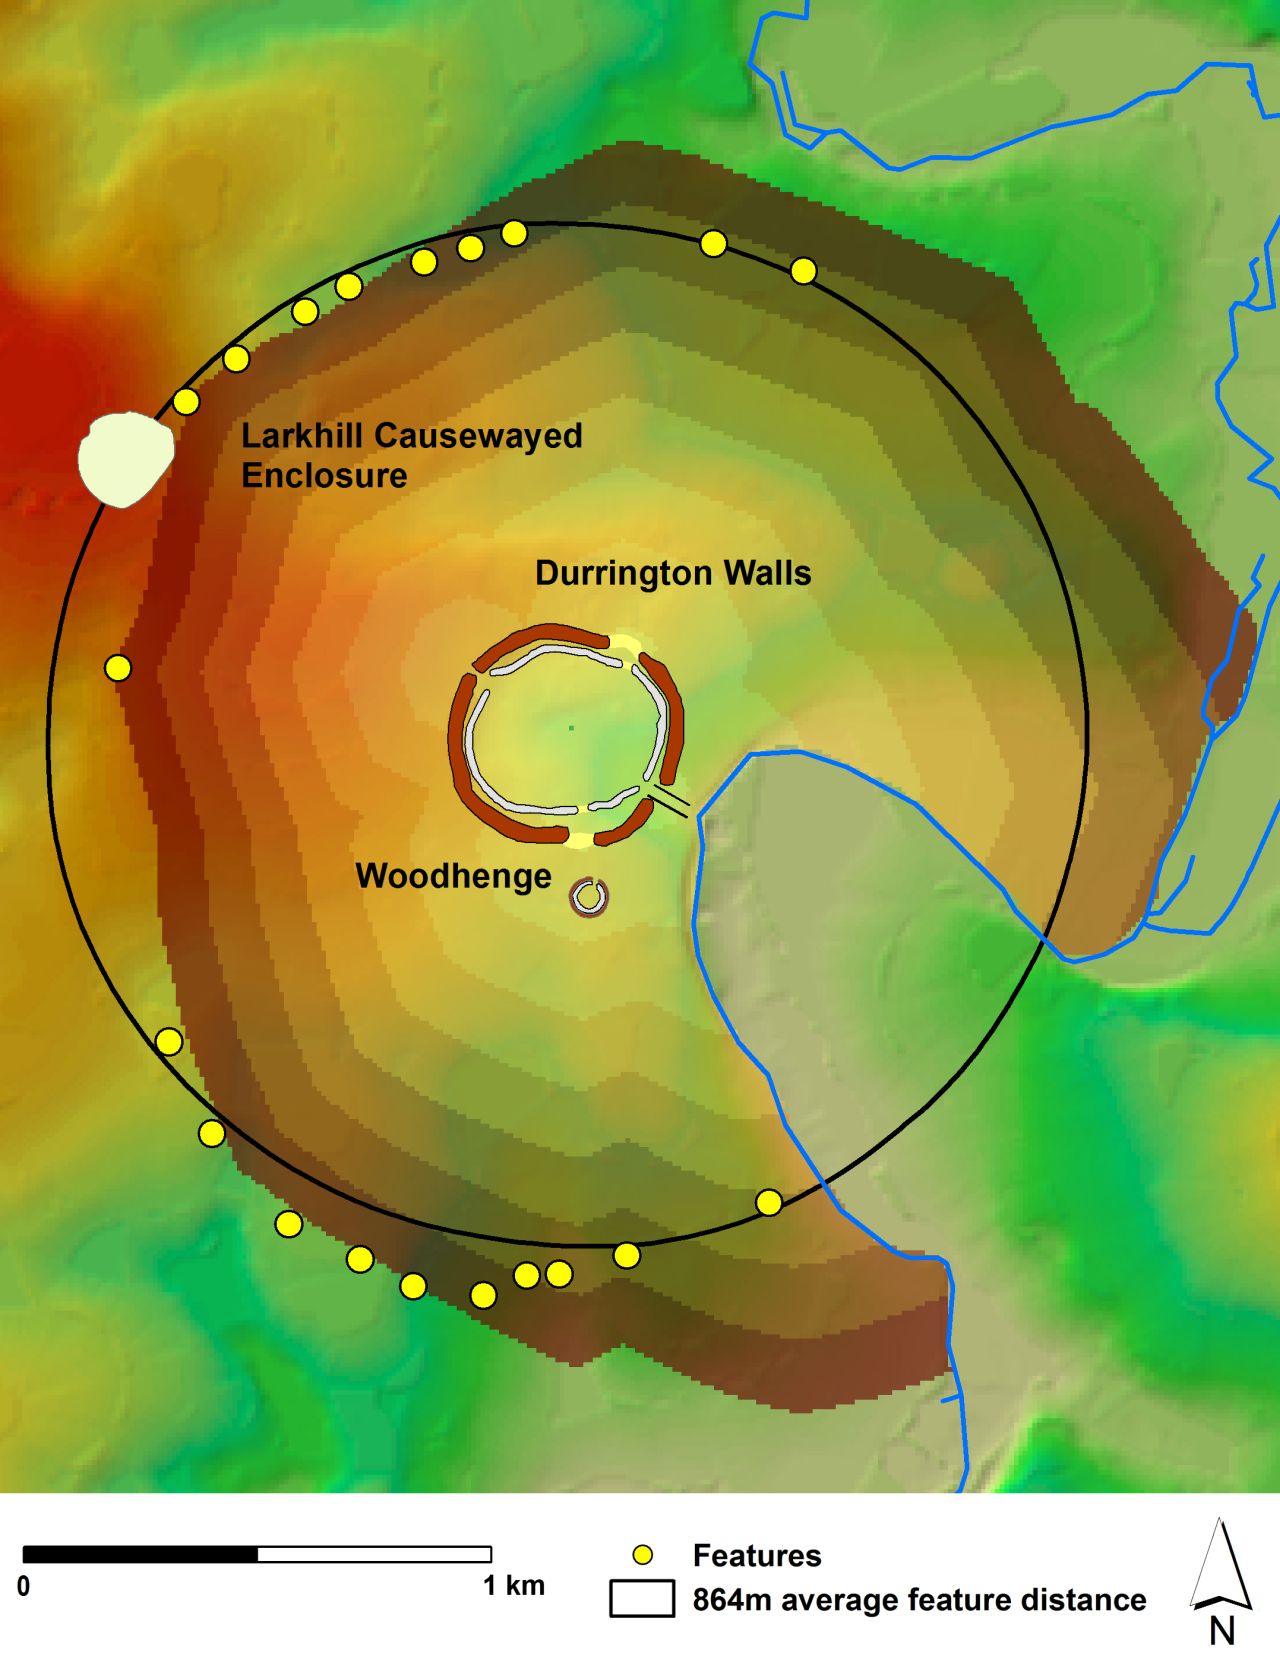
Figure 20: Animation illustrating the landscape setting of the Durrington pit group, major monuments and the average distance from Durrington Walls to identified features as a line. © Crown copyright and database rights 2013 (OS Profile DTM Scale 1:10000); EDINA Digimap Ordnance Survey Service (100025252) http://digimap.edina.ac.uk
Given the presumed later Neolithic date for the pit group, the size of the features, and the scale at which the circuit of pits has been implemented, it is difficult to identify directly comparable groups of features within the British Isles. In respect of clustering of large pits, those associated with, generally earlier, flint mines may invite consideration (Field and Barber 1998; Barber et al. 1999; Mercer 1981). In some instances, such as Cissbury hillfort, large pits associated with mining do form linear alignments; presumably following seams of flint within the boundary of the later Iron Age hillfort (Barber et al. 1999, 29). More locally, work by Booth and Stone (1952) and Stone (1958) record the presence of flint mines near Durrington. However, the illustrations provided by Stone demonstrate that these features are significantly narrower at the entrance than those described above (Figure 21). When considered spatially, Stone's features are also unlikely to be directly linked with the arcs of massive pits presented within this article. While it is not impossible that flint extracted from these pits may have been used on an ad hoc basis, the structural arrangement of the pit group around Durrington Walls, and their apparent link to the area of the henge monument, suggest that such a prosaic interpretation is not sufficient as an explanation for these features.

At a general level, the digging of pits of various sizes is evidenced across the landscape around Durrington and Stonehenge, and more broadly across Britain. Consequently, it would not be unusual to see the pit group at Durrington Walls as falling into a broad tradition of prehistoric pit or shaft digging. The arrangement of pits/shafts within the henge ditch at Maumbury Rings, Dorset, may be worth citing in this context (Bradley 1975). Here a series of shafts c. 3m in diameter, and with estimated original depths between 9 and 12m, were excavated within the ditch of the henge. Radiocarbon dates from red deer antlers within shaft fills (Ambers et al. 1987, 63–4) provided results of 2210–1820 cal BC (95% confidence; BM-2281: 3650±70 BP) and 2210–1780 cal BC (95% confidence; BM-2282: 3640±70 BP). The two measurements are statistically consistent (T'=0.0; df=1; T'(5%)=3.8; Ward and Wilson 1978) and provides a combined calibrated date range of 2150–1890 cal BC (95% probability). While the arrangement of these shafts and their association with a henge may merit some comparison, these features are clearly not of the scale demonstrated by the individual pits at Durrington Walls nor do they approximate the landscape character of the arrangement described above.
The slight possibility that some of the Durrington pits might contain deeper features or even shafts is intriguing, but further work is needed to establish whether these pits are uniformly deep or include other, concealed, features. The later date of 14D approximates the general Middle Bronze dating for the Wilsford Shaft, which has a mean age of 3413±32 BP, although the earliest radiocarbon date from Wilsford comes from a Neolithic wooden bucket (OxA-1089; 4640±70 BP, at 95% confidence (Housley and Hedges 1989, 68). This may suggest that that the shaft originated in the Neolithic, although the majority of the infill occurs during the Middle Bronze Age (Darvill 2005, 41). Despite this, the available evidence cannot yet be taken to suggest that these pits should be directly compared with ritual shafts or wells found elsewhere, including Wilsford or the currently undated shaft at Belle Tout (Allen 2017). However, the broad date range from the Durrington pit group may provide an enlarged context for a tradition linked to the excavation of pits within the Stonehenge landscape and, in that sense, there may be a link.
Several sites further afield might reasonably be seen as potential comparators to the Durrington pits. Excavation and augering of a massive shaft, possibly modified from a solution hollow, at Fir Tree Field, Down Farm in Dorset, invites comparison. Here, a shaft 10m in diameter and over 25m deep provided dates from the Mesolithic to Beaker periods (Green and Allen 1997). The antiquity of the use, or re-use of such a feature, suggests that similar events may have occurred elsewhere. It is also significant that Dr Martin Green also excavated another, later, shaft close to the earlier terminus of the Dorset Cursus (Green 2007). The Monkton-up-Wimborne complex, on Cranborne Chase, incorporates a large circular pit, measuring 10m in diameter and 1.5m deep, surrounded by a circle of 14 pits, and passed by a line of post-holes. The pit contained a 7m deep shaft on its south-eastern edge, associated with a platform, and a multiple burial on the northern edge. The pit appeared to have been used episodically for feasting, and the shaft fill incorporated special deposits including a pecked sandstone ball and a decorated chalk block (French et al. 2007, 112-31). Radiocarbon dates from the upper primary fills of the shaft provided determinations of 3630-3590 and 3530-3360 cal BC (4674±37 BP; Wk-18754). Earlier than the date for 8A, the excavators considered the site as transitional between the demise of causewayed enclosures and the start of henge monuments (French et al. 2007, 122).
While Monkton-up-Wimborne provides an example of a large pit and shaft excavated during the Neolithic, it remains possible that some of the pits around Durrington Walls may have originated as natural solution hollows, and that these were modified and reproduced over time. In this context, the cluster of shafts at Eaton Heath, East Anglia, may be cited (Wainwright 1973). No less than 21 shafts were identified at Eaton Heath. clustering around what may have been a Neolithic settlement area. The group comprised deep shafts, up to 8m in depth and up to 2m diameter, shallower features to 2.8m depth and rarer double shafts. Containing cultural material of Neolithic and Beaker date and providing a 14C date of 3500–2880 cal BC (95% confidence; BM-772; 4444±103 BP) from the basal deposits of shaft 97A, the excavator interpreted these features as anthropogenic. Later re-assessments, however, asserted a natural origin for these features (Garrow 2006, 151; Healy 1986, 57-58). The relative absence of discussion of this site within the literature suggests that the shafts at Eaton Heath may have suffered from the previously unhelpful dichotomy concerning the cultural role of natural features within prehistory (Bradley 2000). Anthropogenic or not, the presence of archaeological materials at Eaton Heath suggests that such features may well have acquired an imbued significance. Consequently, if any of the features near Durrington originate as natural features, it seems reasonable to suggest that a larger monumental circle may have emerged, centred on the area of the Durrington Henge, and involving tens of similar, massive pits. The potential recut of one pit, 5A, during the Middle Bronze Age hints that these features retained significance long after the major period of development and modification of the henge at Durrington Walls.
The spatial arrangement of these features and their relationship to the henge at Durrington Walls, which it effectively encircles, may provide further clues to the nature of the larger group. Overall, the arrangement of features surrounding Durrington Walls gives the impression of an area delineated by a series of massive, intermittent pits and centred on the henge. Such an observation would not be out of place within the Stonehenge landscape. The tendency for some types of monuments, notably round barrows, to cluster in what appears to be concentric, circular arrangements around major monuments has been appreciated for some time (Woodward and Woodward 1996). Such structuration occurs largely as a consequence of the deliberate placement of later monuments at the edges of viewsheds of monuments (Exon et al. 2000). Stigmergic patterning of this sort is clearly culturally embedded and similar underlying processes might reasonably be expected to be in play at Durrington. However, this does not appear to be true. Viewsheds generated from the outline of the henge provide no clear relationship with the positions of the recorded features overall (see supplementary data file 7). None of the features to the north are within sight of the monument, while those in the south are only variably placed in relation to views of the henge. While some features in the south may either see or be seen from the henge, none of the positions occupied by these features provides a quality view towards Durrington Walls that might be anticipated if such a characteristic was deemed to be important to the communities who excavated these pits (Exon et al. 2000, 105). Neither is there a specific visual link to the location of the earlier causewayed enclosure at Larkhill. That monument's view is predominantly orientated to the north and east (supplementary data file 7 and data file 9). Only features 14D and 15D might be visible from both Larkhill and Durrington, and then only if a viewer is positioned at the height of the surrounding banks of the henge.
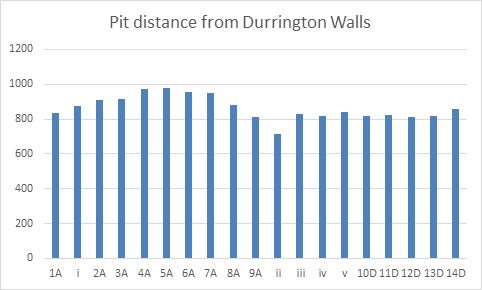
An alternative perspective may emerge if the relationship between the henge, the causewayed enclosure and surrounding features is considered in simple distance terms. When graphed, the pits occur within a relatively constrained band around Durrington Walls, and this incorporates the position of the Larkhill causewayed enclosure (Figure 22). The average pit distance from the henge is c. 864m and most pits lie within 66m of a line based on this measurement. However, while the northern pits (iii-v, 10D-15D), largely conform to a circuit based on that average distance (Figure 22), the southern pits (1A-9A) notably arc away from the average and from Durrington Walls.
If distance is a significant factor in pit location, and the notional distance of these pits requires the incorporation of the Larkhill causewayed enclosure as part of the circuit, then this can usefully be compared to a basic cost distance map to explore the effort of moving to the pits from the henge (Figure 22). With respect to the northern group, both the Euclidean and the cost distance boundaries, cropped at the energy distance to the causewayed enclosure, largely coincide, and the pit distribution reflects this. The correlation appears less good in the central and western sector of the southern group. Here the land is relatively flat and the relative cost of moving the same distance is lower. In these situations, the deviation from any notional, distance boundary may well result from pacing over large distances and the tendency to take longer steps across relatively level land (DoA 2005, 5-10). It is notable that there is a major correction to the east of pit 4A where the pits return to the notional circuit at features i and 1A.
These data may indicate that pit placement was directed towards a notional boundary based on the distance from the henge to, approximately, the boundaries of the causewayed enclosure. The terrain and visibility links between the pit locations and Larkhill in the north presumably also allowed the excavators of the pits to keep, relatively, to the ideal route of the circuit. The lack of visibility to the south, and the differing terrain, led to an increasing divergence from the ideal circuit up until the point the pit alignment was redirected to conform to the ideal geometry. The disparity suggests the boundary may have been laid out by pacing from the henge and, possibly, that the pits may have been located sequentially away from Larkhill
Another point follows from the presumed link between the Larkhill and Durrington Wall enclosures. The excavators of the enclosure have suggested that the site at Larkhill may possess a number of potentially significant alignments within the dated features from the site. The alleged orientation of the posts with the midsummer solstice at sunrise has already been noted (Daw 2018). However, if these posts were associated with the circuit of pits, and comparable to those posts located by excavation in the northern group, and through geophysical survey in the southern group, then this arrangement may have a different rationale.
The general position of the causewayed enclosure on an alignment with the henge entrances at Durrington has also been noted (Current Archaeology 2017). However, the issues of astronomic alignments at Durrington Walls are complex (Ruggles 2015, 1232-33; supplementary data file 9). Durrington Walls southern circle has a solstitial alignment to the south-east and the midwinter solstice, but, because of the sloping ground, this is not necessarily true for the north-west alignment. However, the short avenue linking Durrington Walls to the Avon may be aligned closely to the summer solstice sunset to the north-west and it is true that, in general terms, the earlier causewayed enclosure may be associated with such an arrangement.
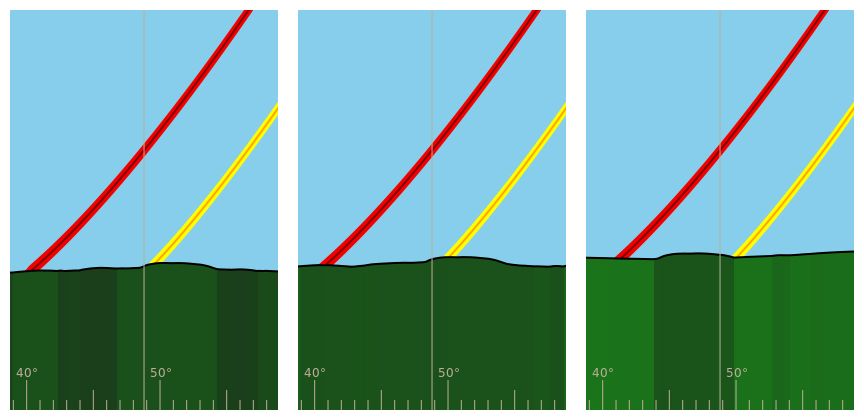
The visual characteristics of the pits are of interest when considering the potential for alignments within the larger monument complex. These, in part, reflect the binary visual arrangement of the northern and southern pits groups. The southern group largely links to Durrington Walls, and the northern group, largely, to the Larkhill causewayed enclosure. Analysis contained within supplementary data file 9 suggests that while the southern group of pits possess similar views towards the winter solstice sunrise in the direction of Boscombe Down, that group has no particular visual focus and their horizon views are equally varied. In contrast, the northern pits generally follow that of the Larkhill causewayed enclosure and demonstrate consistent views towards the north-east and, specifically, Sidbury Hill. Indeed, as the viewpoint moves downhill from the causewayed enclosure, the solstice sunrise moves from the north to the south of Sidbury Hill (Figure 24). In some sense the pits may inherit this characteristic from the causewayed enclosure through their placement and apparent intent to incorporate the earlier site within the pit circuit.
Further, detailed study of the pits is currently hindered by the lack of information for c. 40% of the hypothetical circuit. This may be particularly significant for any pits to the north-east of Durrington Walls and in the direction of dawn on the summer solstice: presupposing the presence of pits in those areas that are currently blank. Despite this, the position of the enclosure at Larkhill on, apparently, a series of alignments suggests that the arrangement of the pit boundary also relates to aspects of the contemporary cosmography at a massively enlarged scale (Darvill 1997). If so, the vexed issue of the north-western entrance to Durrington Walls henge becomes significant. Initially postulated by Crawford (1929, 54–56, plate III), the entrance is complicated by the presence of a large scarp that lies between the bank and ditch, and which must pre-date the enclosure (Gaffney et al. 2018, 10). The area associated with the postulated entrance is very steep, uneven and heavily disturbed and the geophysical survey data from the henge is ambiguous regarding whether an entrance actually exists at this point. The apparent link with Larkhill does make a stronger logical case for such a gap, although it may be considered that any breach in the henge boundaries might as well be interpreted as a sight line as an entrance. Further work is essential to clarify this issue.
The significance of the pit arrangement and how it may have functioned is, of course, less certain. The desire to maintain a notional geometry through the placement of these large pits is impressive and is presumably representative of the deeper concern with circular, bounded spaces that are evident elsewhere in the Neolithic and Bronze Age landscapes of Britain (Whittle 1997a, 147-8; Darvill 1997). However, the scale of implementation is remarkable. Aside from the effort of digging so many large pits (see supplementary data file 8), the area enclosed is significantly larger than, for instance, the Greater Cursus, which encloses c. 0.37km². In comparison, the area enclosed by the pits, excluding the land east of the Avon, may be as large as 3.1km².
Although visually striking, the apparent regularity demonstrated through the pit placement need not require any recourse to the existence of standard metrics during the Late Neolithic (Chamberlain and Parker Pearson 2007; Teather et al. 2019). The variation in the pit circuit does not suggest that precision was required and the goal to achieve an approximate distance appears to have been achieved through pacing. However, the distances involved may suggest the existence of a tally system to record steps rather than directly measure distance. Anthropology provides substantial evidence for a variety of tally systems across many societies, including those based on parts of the body (Biersack 1982; Owens 2001). Such systems are not themselves an explanation for the distribution of the pits but, in many societies, tallies or counts may themselves possess culturally embedded values and provide social linkages to status, enumerate kinship distance and other social information (Biersack 1982; Bowers and Lepi 1975). Archaeologically, some early tallies do appear to have linkages with astronomic, and, presumably, cosmological cycles (Rappenglück 2010). Without recourse to the extremes of numerology, it is conceivable that the act of pacing out a notional pattern on the ground might well have reinforced perceived cosmological linkages and these, in turn, may have been inscribed into the landscape through the massive pits found at Durrington.
Following from such considerations, other characteristics of imbued boundaries may be guided by comparative studies elsewhere within the Stonehenge landscape. The preferential location of monuments on significant edges include the barrow groups associated with the 'Stonehenge Envelope', the visual territory of Stonehenge, and may be relevant here (Woodward and Woodward 1996; Exon et al. 2000). Previous researchers have suggested that the burial mounds surrounding Stonehenge defined an area within which only a select few entered (Parker Pearson and Ramilisonina 1998). In relative terms, the area demarcated by the Stonehenge Envelope is c. 3.13km², an area that approximates that bounded by the pits at Durrington. It may be that we are witnessing a similar arrangement around Durrington Walls marked, uniquely, by the digging of massive pits laid out with reference to a much earlier monument, the Larkhill causewayed enclosure.
The arrangement of the pit group and the bounded space around Durrington may have other parallels to the visual territory of Stonehenge. The relationship of Durrington with the southern pit group, and perhaps the unexplored sector orientated towards the summer solstice, contrasts visually with those pits to the north and north-west. The southern group of pits are largely visible to the henge monument while those to the north-west, and including the site of the causewayed enclosure, are essentially invisible to the henge. Stonehenge has a very similar relationship with the Greater Cursus (Exon et al. 2000, chapter 5). The monument is visually linked to the cursus in its eastern half and towards dawn on the summer solstice, but the western section of the cursus, in the direction of the setting sun, has no such visual link. Interestingly, views from Stonehenge towards dawn and dusk on the solstice appear to be marked by two, large, but currently unexplored pits within the Cursus itself (Gaffney et al. 2012).
If the pits encircling Durrington Walls do define a special area, similar to that proposed for Stonehenge, then access to Durrington Walls, following its monumentalisation as a henge enclosure, may have been similarly restricted. Movement towards the monument was, perhaps, channelled via the River Avon and the short avenue linking the river to the henge or guided in other ways through the pit boundary to the henge.
The data presented here suggest that a series of features, most likely large pits, surrounds the Durrington Walls henge enclosure, and that this group represents an elaboration of the monument complex at a massive, and unexpected, scale. Analysis indicates that the surviving pits may have been laid out with respect to the recently discovered Larkhill causewayed enclosure. The data also hint at evidence for the maintenance of this monumental structure into the Middle Bronze Age which, if correct, would have significant implications for our understanding of the history and development of monumental structures across the Stonehenge landscape.
The discovery of the Durrington pit circuit is surprising and confirms the capacity of remote sensing projects to contribute to our understanding of large-scale landscape structuration during the Neolithic and Bronze Ages (Gaffney et al. 2012; Trinks et al. 2018). Having recognised the scale of the pit circuit, it remains important to recognise that such a group does have a context within the Late Neolithic: a period when ritual structures might be monumentalised at an enormous scale. Parallels to large enclosures such as those at Hindwell and Walton (Gibson 1996; 1999), or indeed the great palisaded enclosures, including West Kennet and Dunragit (Whittle 1997b; Thomas 2015), are attractive in terms of relative scale, but the lack of a full chronology for the Durrington pits remains problematic. It is also true that the concept of the pit group acting as a complex boundary, perhaps with its putative, associated post structure, may also find local parallels in the arrangements of monuments and spaces within the Stonehenge landscape, and specifically the Stonehenge Envelope. However, the results provided here are preliminary. We cannot yet be certain when the excavation of the pits surrounding Durrington Walls was initiated, how long it took for the larger structure to emerge, or even the final form achieved by individual pits. Their detailed relationship to the increasingly complex sequence of construction at Durrington Walls remains to be elucidated. Consequently, further work is required on the cultural and chronological context of the unique pit group described within this article, and the identification of such a large structure also emphasises the need to reassess the issues of pits/shafts within this period more generally.
A full list of individuals and contractors involved in fieldwork supporting this article is contained in supplementary data file 10. Here we would like to acknowledge and thank the National Trust, and specifically Dr Nick Snashall and Ian Barnes, for facilitating the fieldwork reported here and tenants Bill King and Hugh Morrison who kindly provided access to their land to undertake fieldwork. Professor Bridgeman and Dr Richard Dunn supported the project through the provision of a grant for fieldwork from the University of Bradford research development fund. Dr Martin Green, Professor Mike Parker Pearson, Professor Julian Thomas and Dr Philippe De Smedt commented on the text, and we must express our thanks to Professor Richard Bradley who provided both encouragement and advice throughout the preparation of this report.
The original magnetic survey of the southern pit group was undertaken as part of the 'Stonehenge Hidden Landscapes Project' as part of an international collaborative research programme through the Ludwig Boltzmann Institute for Archaeological Prospection and Virtual Archaeology (https://archpro.lbg.ac.at) incorporating the Ludwig Boltzmann Gesellschaft (Austria), Amt der Niederösterreichischen Landesregierung (Austria), the University of Vienna (Austria), the Vienna University of Technology (Austria), ZAMG Central Institute for Meteorology and Geodynamics (Austria), Airborne Technologies (Austria), 7reasons (Austria), ÖAW– Austrian Academy of Sciences (Austria), ÖAI – Austrian Archaeological Institute (Austria), RGZM Mainz – Römisch-Germanisches Zentralmuseum Mainz (Germany), the University of Birmingham in collaboration with the University of Bradford (GB), Arkeologerna of Statens Historiska Museer (Sweden), NIKU – Norwegian Institute for Cultural Heritage (Norway), and Vestfold fylkeskommune – Kulturarv (Norway).
The authors would like to thank the anonymous reviewers of the article for their consideration and thoughtful comment on the original text.
Internet Archaeology is an open access journal based in the Department of Archaeology, University of York. Except where otherwise noted, content from this work may be used under the terms of the Creative Commons Attribution 3.0 (CC BY) Unported licence, which permits unrestricted use, distribution, and reproduction in any medium, provided that attribution to the author(s), the title of the work, the Internet Archaeology journal and the relevant URL/DOI are given.
Terms and Conditions | Legal Statements | Privacy Policy | Cookies Policy | Citing Internet Archaeology
Internet Archaeology content is preserved for the long term with the Archaeology Data Service (ROR). Help sustain and support open access publication by donating to our Open Access Archaeology Fund.
 Home
Home