Cite this as: Gaffney, V., Baldwin, E., Allaby, R., Bates, M., Bates, R., Finlay, A., Gaffney, C., Hansford, T., Kinnaird, T., Neubauer, W., Löcker, K., Sparrow, T., Trinks, I., Wallner, M. and Ch’ng, E. 2025 The Perils of Pits: further research at Durrington Walls henge (2021-2025), Internet Archaeology 69. https://doi.org/10.11141/ia.69.19
| Field ID | Lab. code | Depth cm | Chemozone | Palaeodose/Gy | Dose rate/mGy a-1 | Age/ka | Calendar years |
|---|---|---|---|---|---|---|---|
| WS-1A-13 | 579-13 | 187 | ? | 1.46 ± 0.04 | 1.04 ± 0.05 | 1.41 ± 0.08 | AD 610 ± 80 |
| WS-1A-14 | 579-14 | 195 | ? | 1.49 ± 0.05 | 1.00 ± 0.05 | 1.49 ± 0.08 | AD 530 ± 80 |
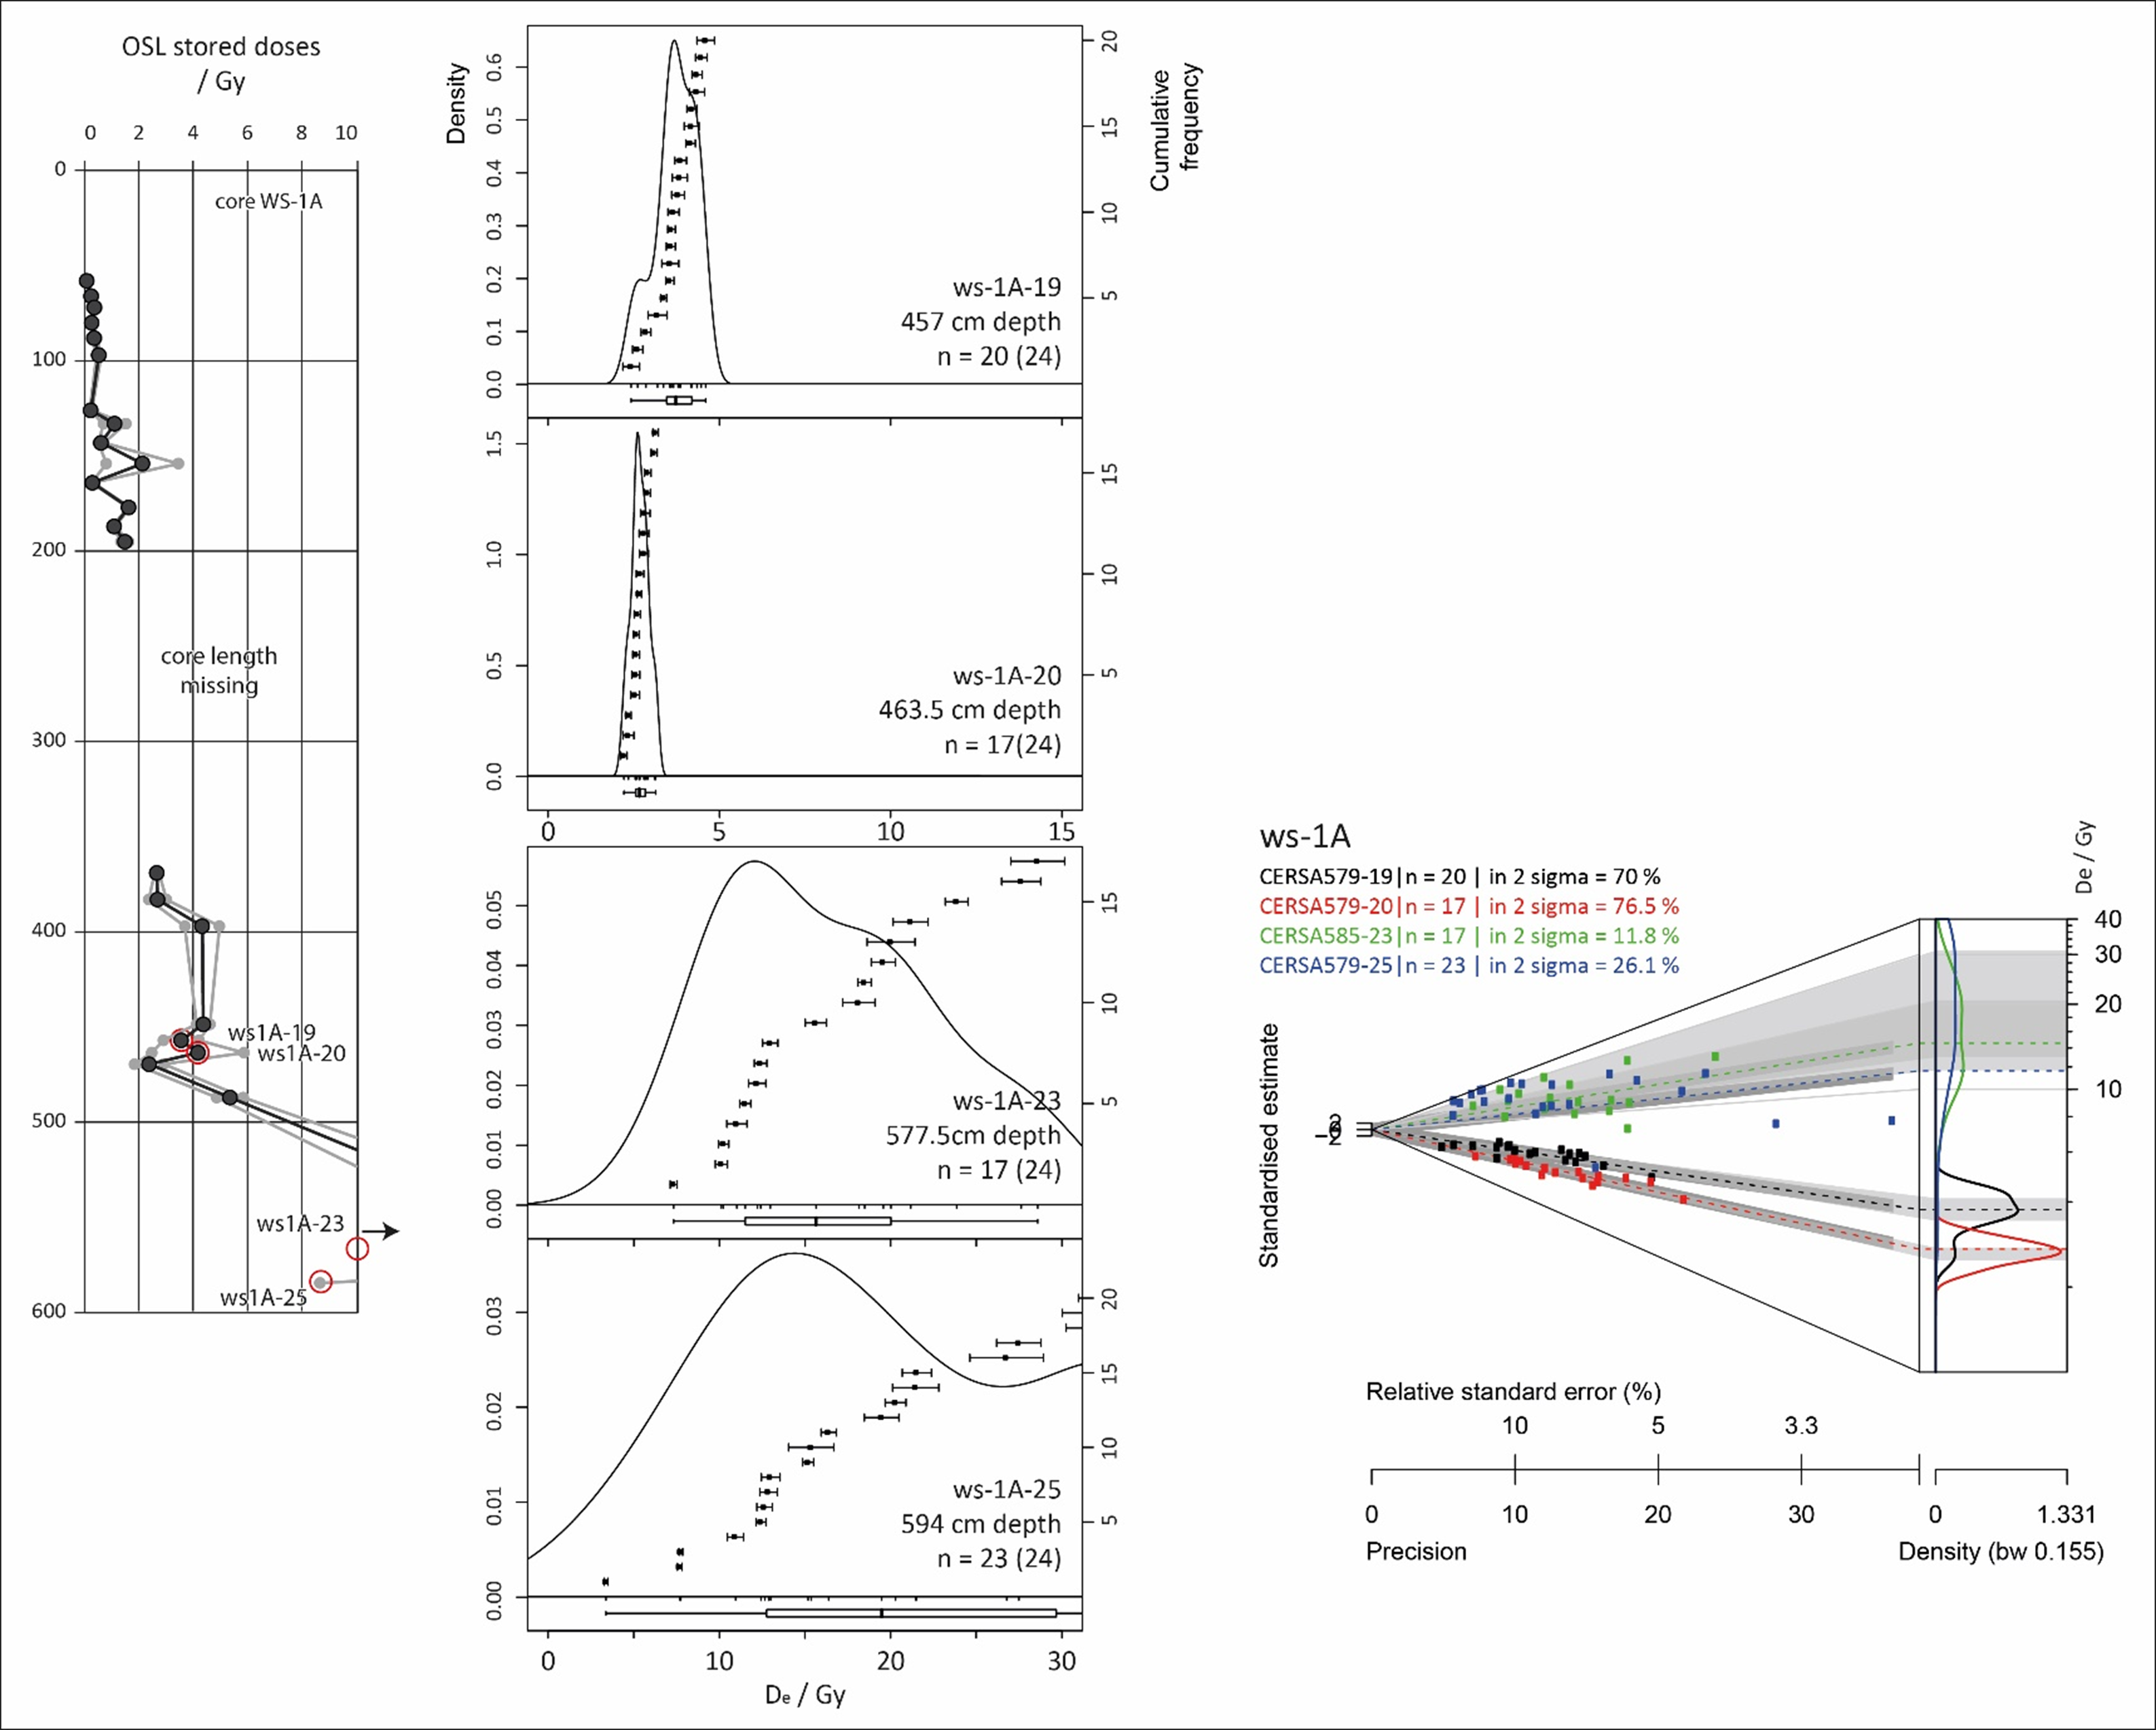
| WS-1A-19 | 579-19 | 457 | 3 | 3.65 ± 0.15 | 0.71 ± 0.06 | 5.14 ± 0.48 | 3120 ± 480 BC |
| WS-1A-20 | 579-20 | 464 | 3 | 2.68 ± 0.07 | 0.63 ± 0.06 | 4.24 ± 0.44 | 2220 ± 440 BC |
| WS-1A-23 | 579-23 | 578 | 4 | 11.88 ± 1.73 | 0.69 ± 0.08 | 17.14 ± 3.14 | > |
| WS-1A-24 | 579-24 | 585 | 4 | 7.87 ± 1.67 | 0.71 ± 0.08 | 11.14 ± 2.67 | > |
| WS-1A-25 | 579-25 | 594 | 4 | 7.71 ± 2.40 | 0.72 ± 0.08 | 10.67 ± 3.53 | > |
| WS-2A-43 | 581/43 | 669 | ? | 2.02 ± 0.05 | 5.19 ± 0.15 | 2.58 ± 0.1 | 550 ± 100 BC |
| WS-2A-44 | 581/44 | 681 | ? | 1.95 ± 0.08 | 4.38 ± 0.26 | 2.25 ± 0.16 | 220 ± 160 BC |
| WS-16D-10 | 585-10* | 123 | 1 | 3.27 ± 0.14 | 1.63 ± 0.05 | 1.94 ± 0.10 | AD 80 ± 100 |
| WS-16D-15 | 585-15* | 175 | 1 | 4.11 ± 0.10 | 1.69 ± 0.05 | 2.36 ± 0.10 | 340 ± 100 BC |
| WS-16D-27 | 585-27* | 333 | 2 | 2.67 ± 0.05 | 1.10 ± 0.05 | 2.36 ± 0.12 | 340 ± 120 BC |
| WS-16D-28 | 585-28 | 344 | 2 | 2.53 ± 0.09 | 0.96 ± 0.05 | 2.64 ± 0.17 | 620 ± 170 BC |
| WS-16D-30 | 585-30 | 385 | 2 | 2.52 ± 0.17 | 0.98 ± 0.06 | 2.55 ± 0.23 | 540 ± 230 BC |
| WS-16D-34 | 585-34* | 400 | 3 | 3.63 ± 0.08 | 0.89 ± 0.04 | 3.96 ± 0.21 | 1940 ± 210 BC |
| WS-16D-37 | 585-37* | 450 | 3 | 3.88 ± 0.09 | 0.82 ± 0.05 | 4.59 ± 0.28 | 2570 ± 280 BC |
| WS-16D-39 | 585-39 | 484 | 3 | 4.49 ± 0.22 | 0.99 ± 0.05 | 4.53 ± 0.31 | 2510 ± 310 BC |
| WS-16D-40 | 585-40 | 495 | 3 | 4.99 ± 0.20 | 1.08 ± 0.04 | 4.63 ± 0.26 | 2610 ± 260 BC |
| WS-16D-40b | 585-40 to 41* | 500 | 3 | 5.07 ± 0.08 | 1.07 ± 0.07 | 4.62 ± 0.30 | 2600 ± 300 BC |
| WS-16D-41 | 585-41 | 571 | 4 | 4.92 ± 0.41 | 0.81 ± 0.04 | 6.08 ± 0.60 | 4060 ± 600 BC |
| WS-16D-41b | 585-41 to 42* | 582 | 4 | 4.59 ± 0.65 | 0.76 ± 0.04 | 5.87 ± 0.88 | 3850 ± 880 BC |
| WS-13D1-19 | 577/19 | 215 | 1 | 3.27 ± 0.07 | 1.22 ± 0.07 | 2.69 ± 0.16 | 670 ± 160 BC |
| WS-13D1-20 | 577/20 | 226 | 2 | 3.50 ± 0.07 | 1.38 ± 0.06 | 2.54 ± 0.12 | 520 ± 120 BC |
| WS-13D1-21 | 577/21 | 239 | 2 | 3.05 ± 0.06 | 1.24 ± 0.06 | 2.47 ± 0.13 | 450 ± 130 BC |
| WS-13D1-22 | 577/22 | 252 | 2 | 3.65 ± 0.16 | 1.39 ± 0.07 | 2.63 ± 0.17 | 610 ± 170 BC |
| WS-13D1-23 | 577/23 | 263 | 2 | 3.90 ± 0.08 | 1.29 ± 0.06 | 3.02 ± 0.15 | 1010 ± 150 BC |
| WS-13D1-24 | 577/24 | 281 | 3 | 4.18 ± 0.18 | 1.08 ± 0.06 | 3.87 ± 0.28 | 1850 ± 280 BC |
| WS-13D1-25 | 577/25 | 293 | 3 | 4.04 ± 0.17 | 0.92 ± 0.06 | 4.40 ± 0.35 | 2390 ± 350 BC |
| WS-13D1-26 | 577/26 | 325 | 3 | 4.38 ± 0.13 | 0.98 ± 0.06 | 4.48 ± 0.30 | 2460 ± 300 BC |
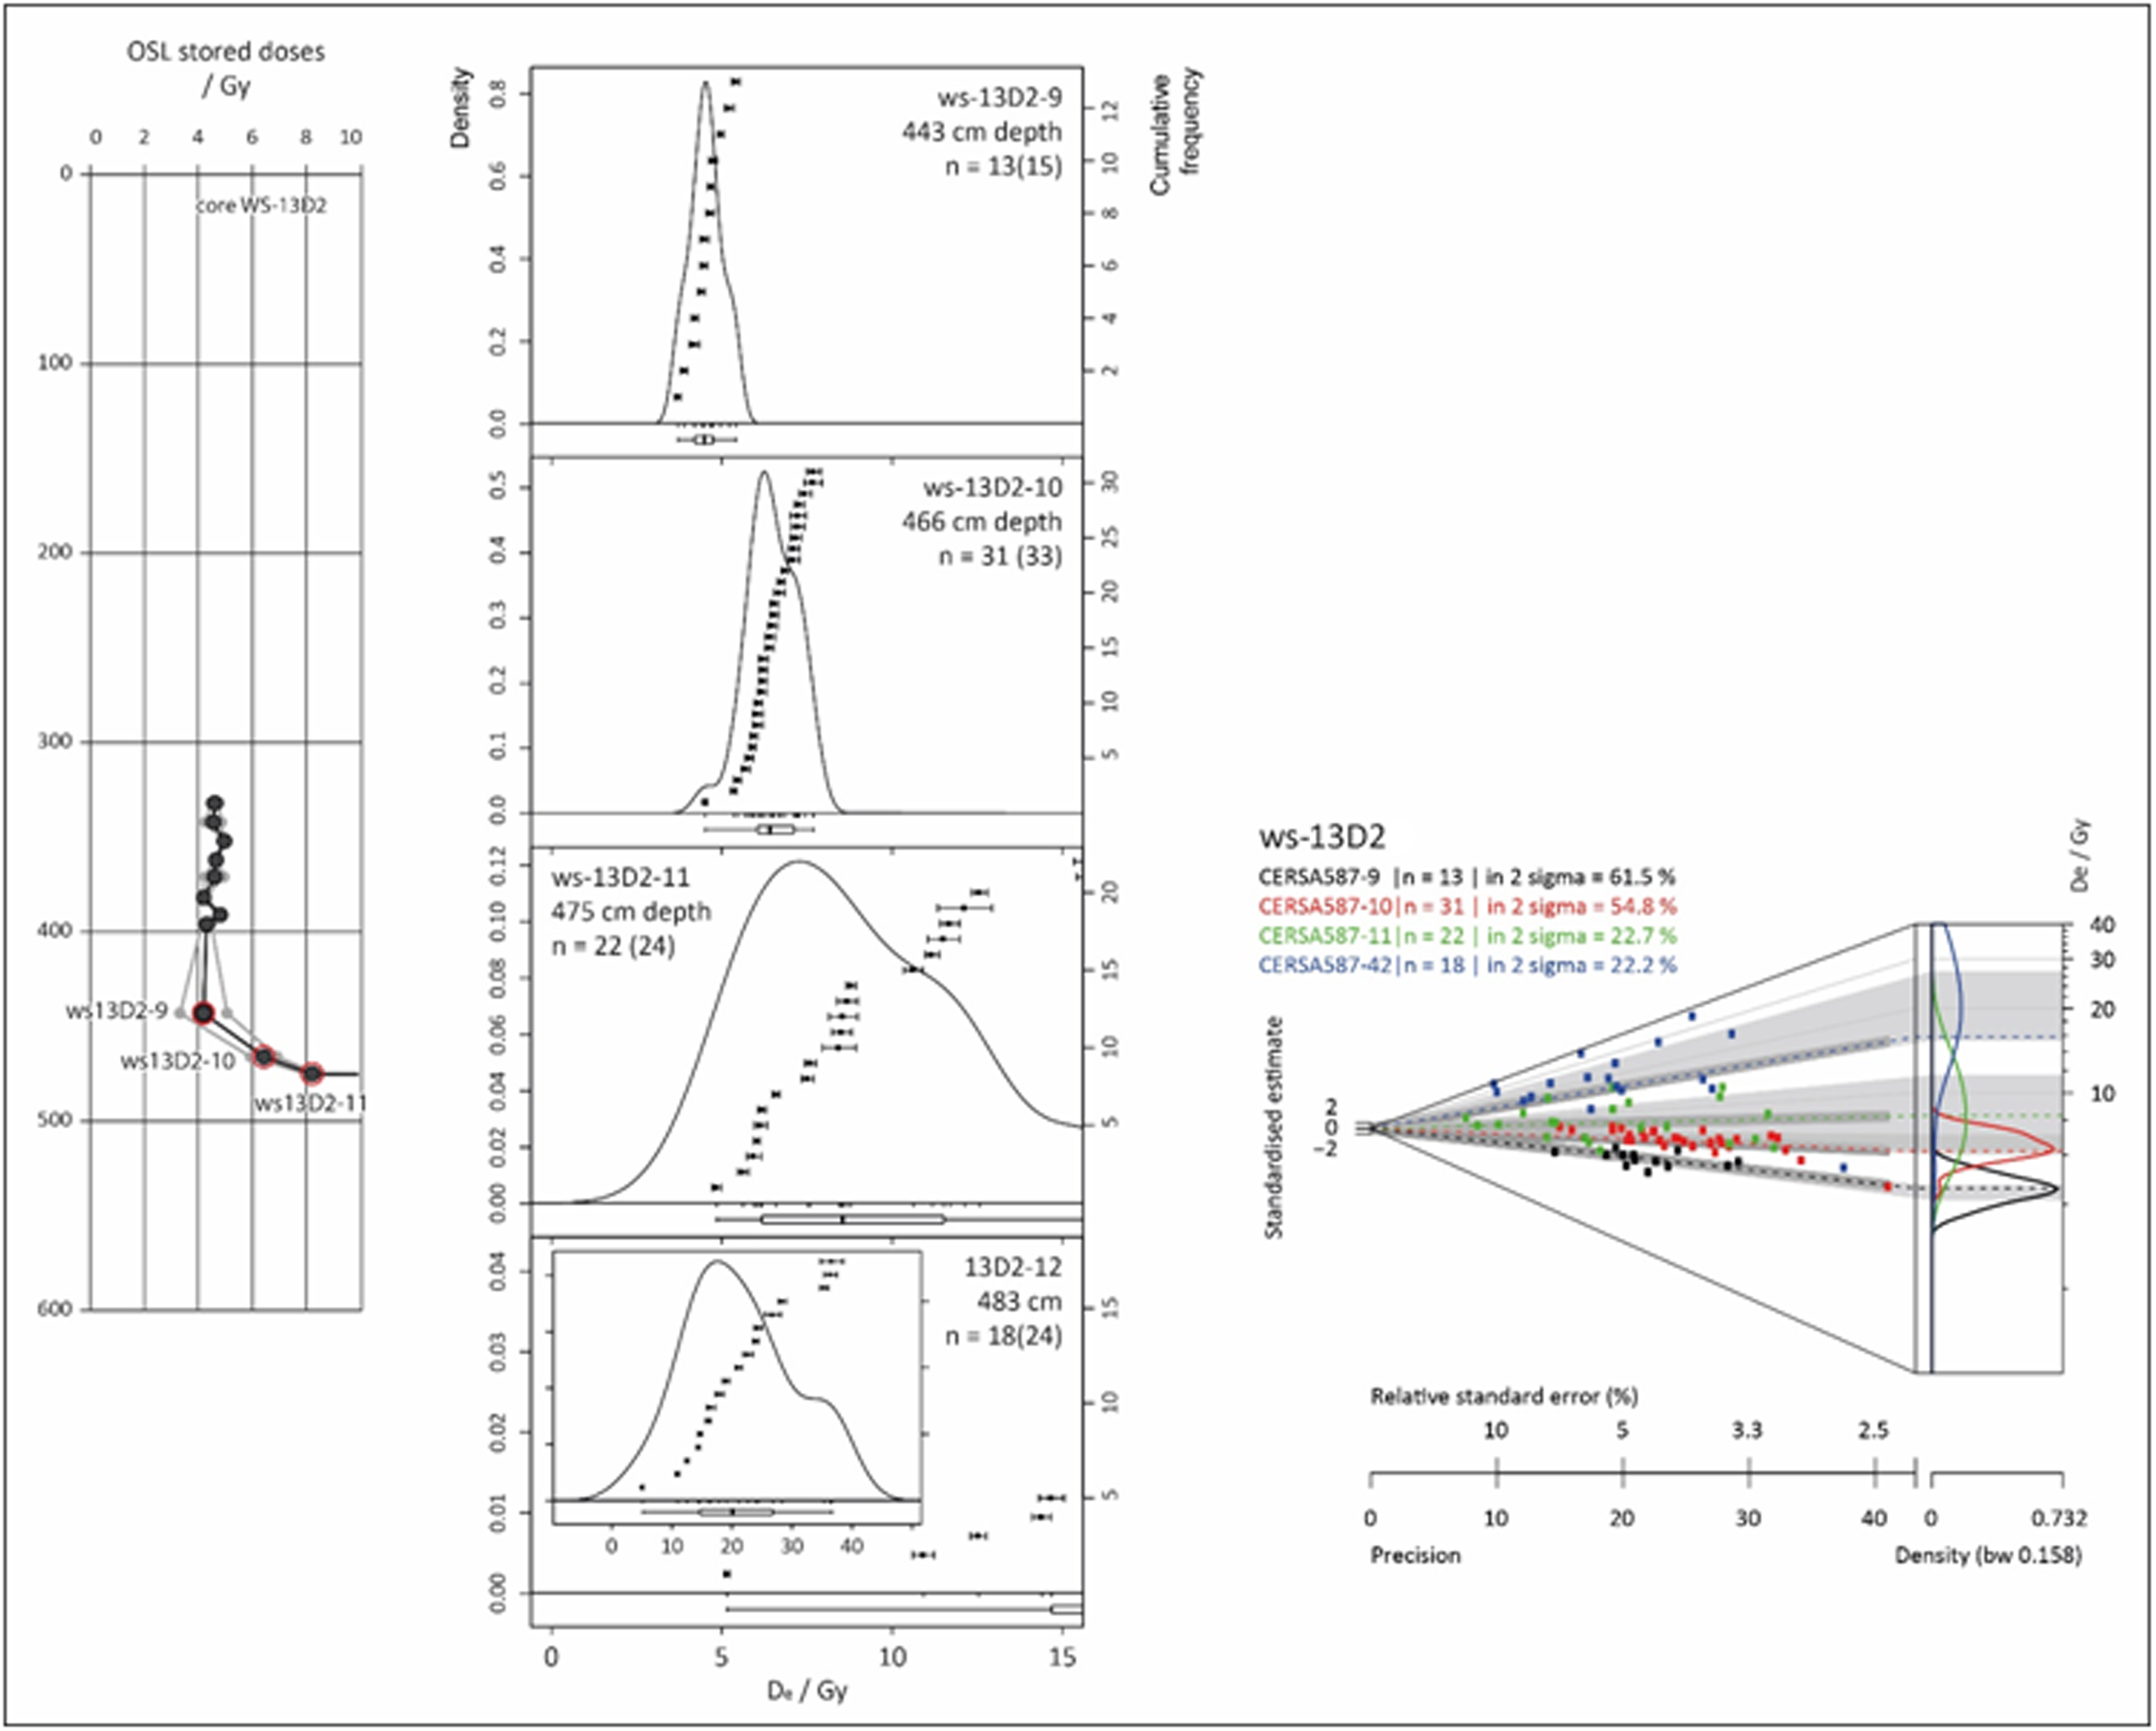
| WS-13D2-9 | 587/9 | 443 | 2 | 4.49 ± 0.14 | 1.57 ± 0.06 | 2.87 ± 0.14 | 850 ± 140 BC |
| WS-13D2-10 | 587/10 | 466 | 3 | 6.02 ± 0.20 | 1.32 ± 0.06 | 4.57 ± 0.25 | 2550 ± 250 BC |
| WS-13D2-11 | 587/11 | 475 | 4 | 7.26 ± 0.67 | 1.22 ± 0.06 | 5.95 ± 0.62 | 3930 ± 620 BC |
| WS-13D2-12 | 587/12 | 483 | 4 | > | 1.11 ± 0.07 | > | > |
Table 8.1 lists the burial doses, total effective environmental dose rates and OSL depositional ages obtained from sediment recovered from cores WS-1A, WS-2A, WS-16D, WS-13D1 and WS13-D2. This supplementary data file details the background to the OSL investigations, sampling and OSL profiling (stage 1), and the progression to analytical work, first to calibrated luminescence screening (stage 2), then to quantitative quartz SAR OSL dating (stage 3).
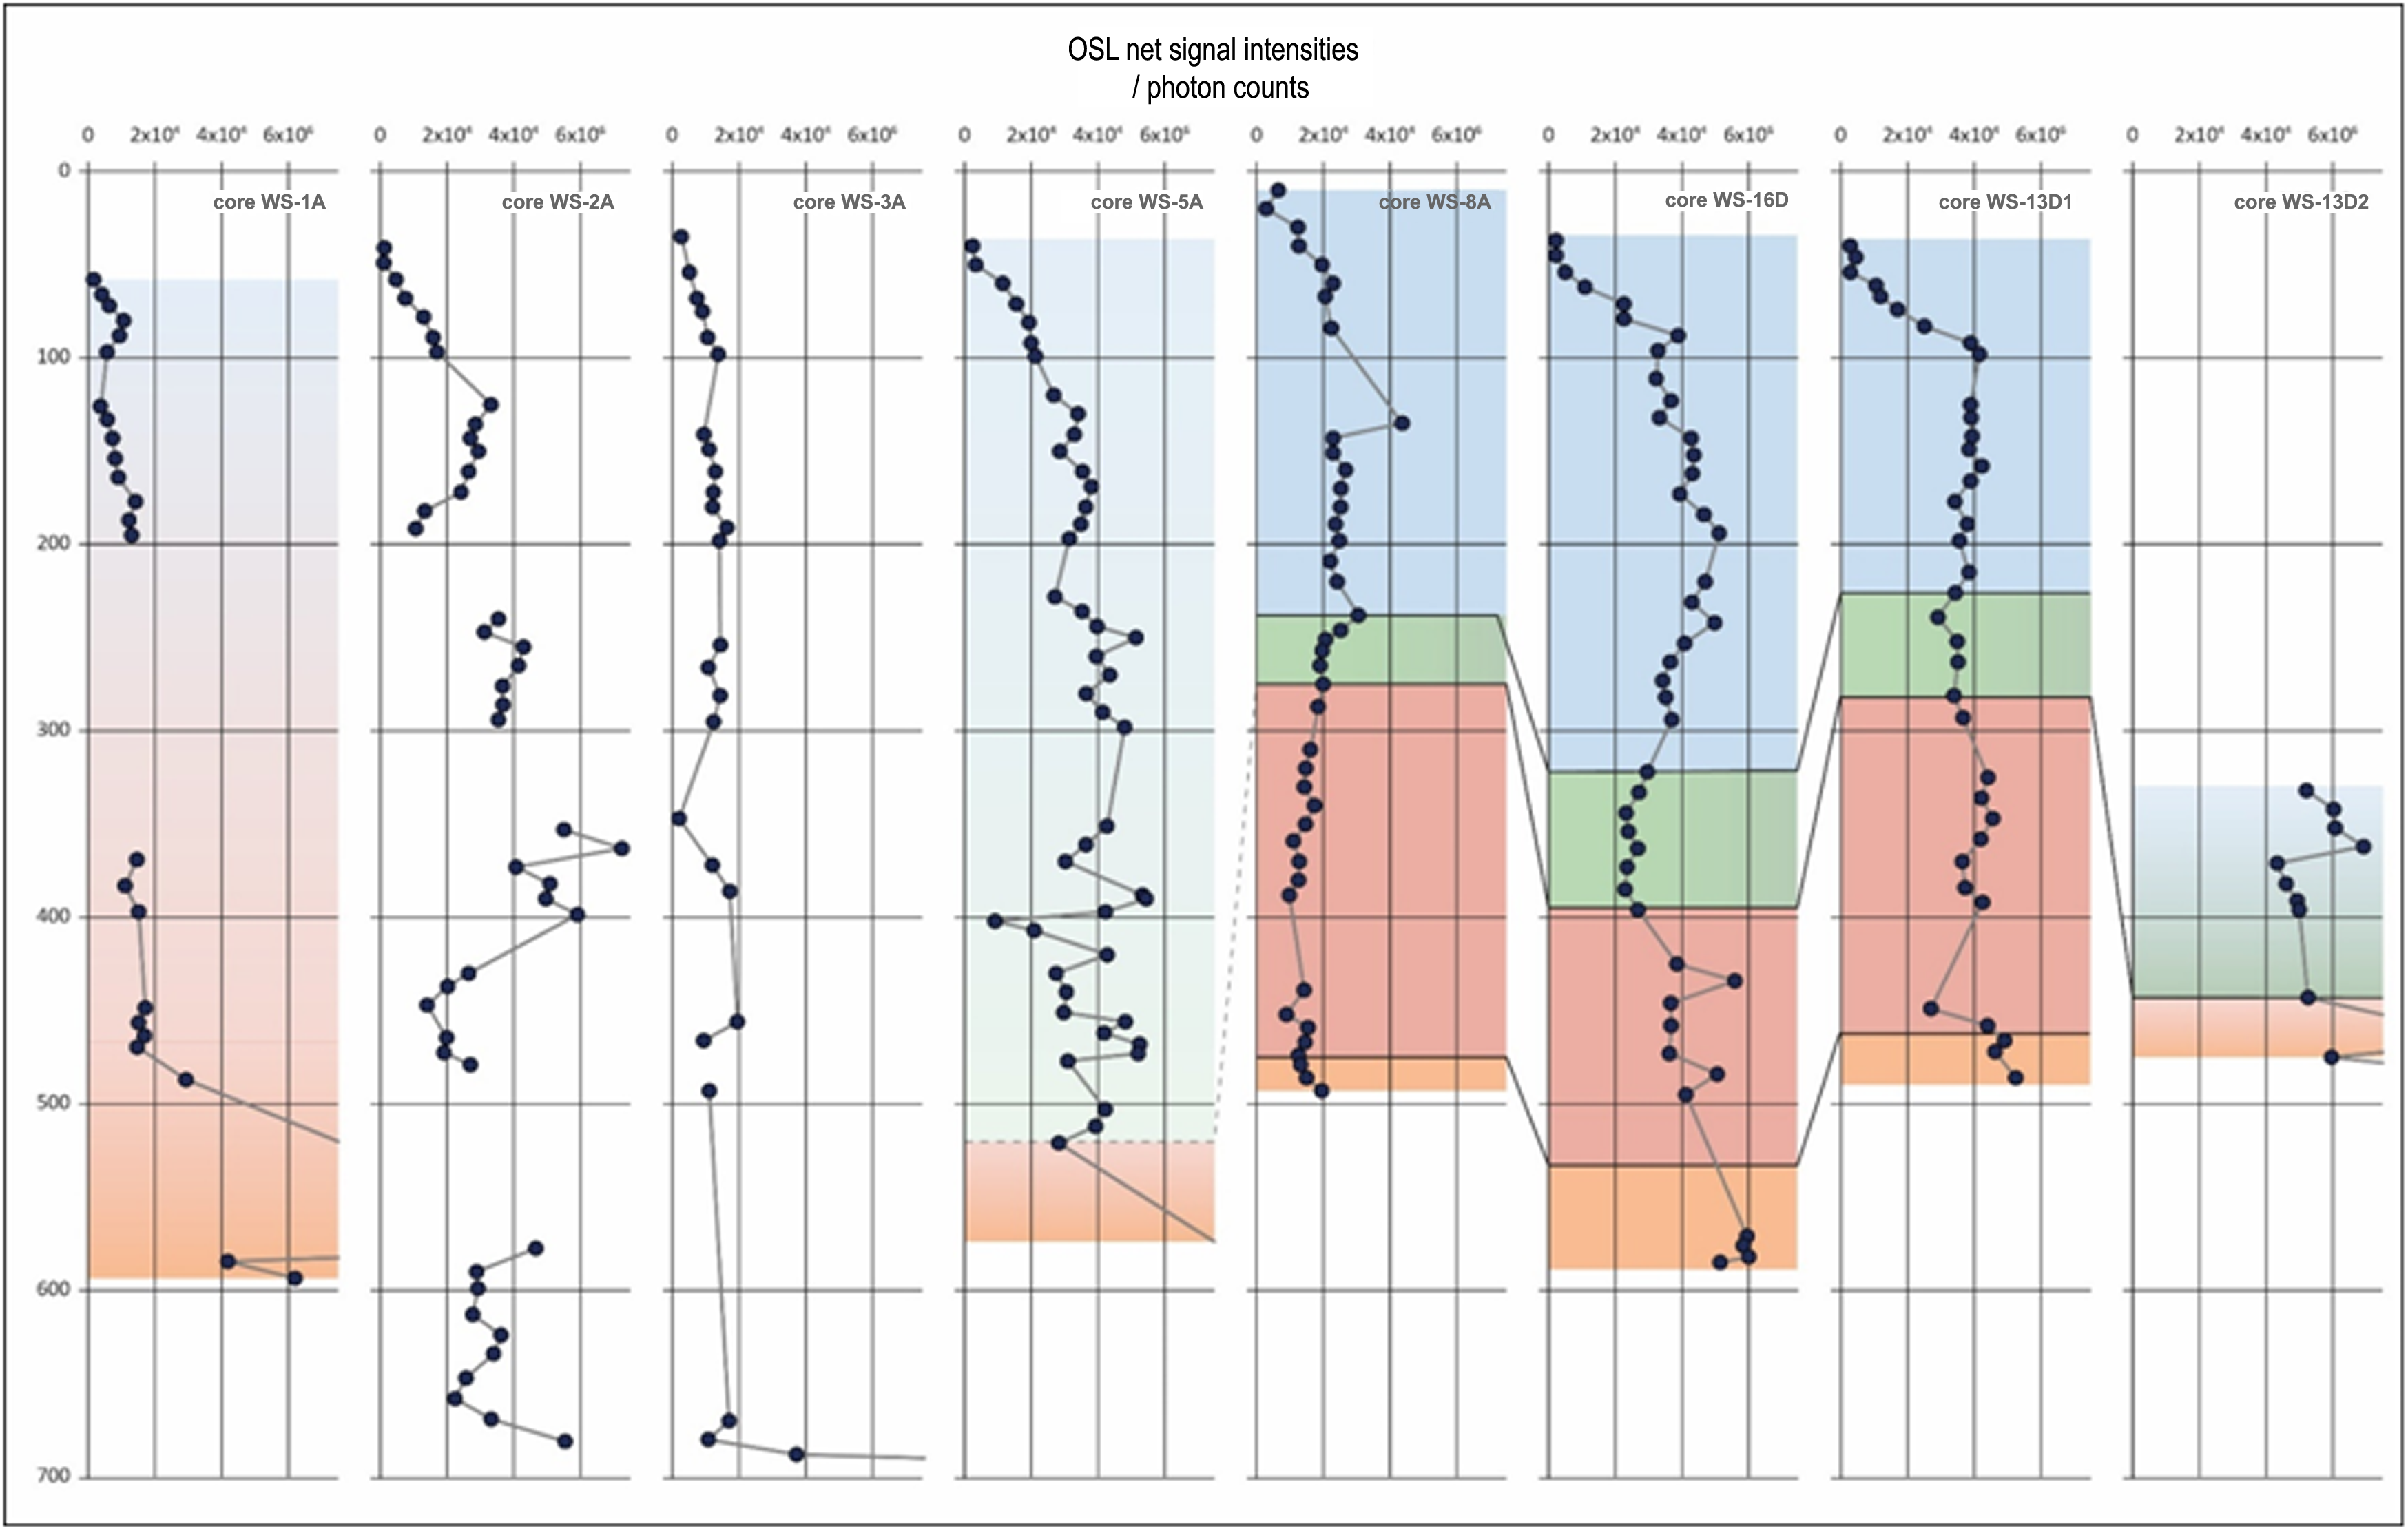
Stage 1: Preliminary OSL screening and sampling. Sediment recovered from 8 cores – WS-1A, WS-2A, WS-3A, WS-5A, WS-8A, WS-16D, WS-13D1 and WS-13D2 – was screened for its bulk luminescence behaviour using portable OSL equipment (see Munyikwa et al. 2021 for details of the equipment; Kinnaird et al. 2025 for the methodology). In total, 286 samples were appraised from across the 8 cores: 25 from WS-1A, 44 from WS-2A, 28 from WS-3A, 42 from WS-5A, 54 from WS-8A, 44 from WS-16D, 37 from WS-13D1 and 12 from WS-13D2 (Fig. 8.1).
The resulting IRSL and OSL net signal intensities, depletion indices and IRSL:OSL ratios were used to plot luminescence stratigraphies and build hypotheses on the depositional histories of the fills (Fig. 8.1). Samples for subsequent laboratory analysis (stages 2 and 3) were positioned within the cores, with tighter resolution sampling around the key stratigraphic breaks and progressions.
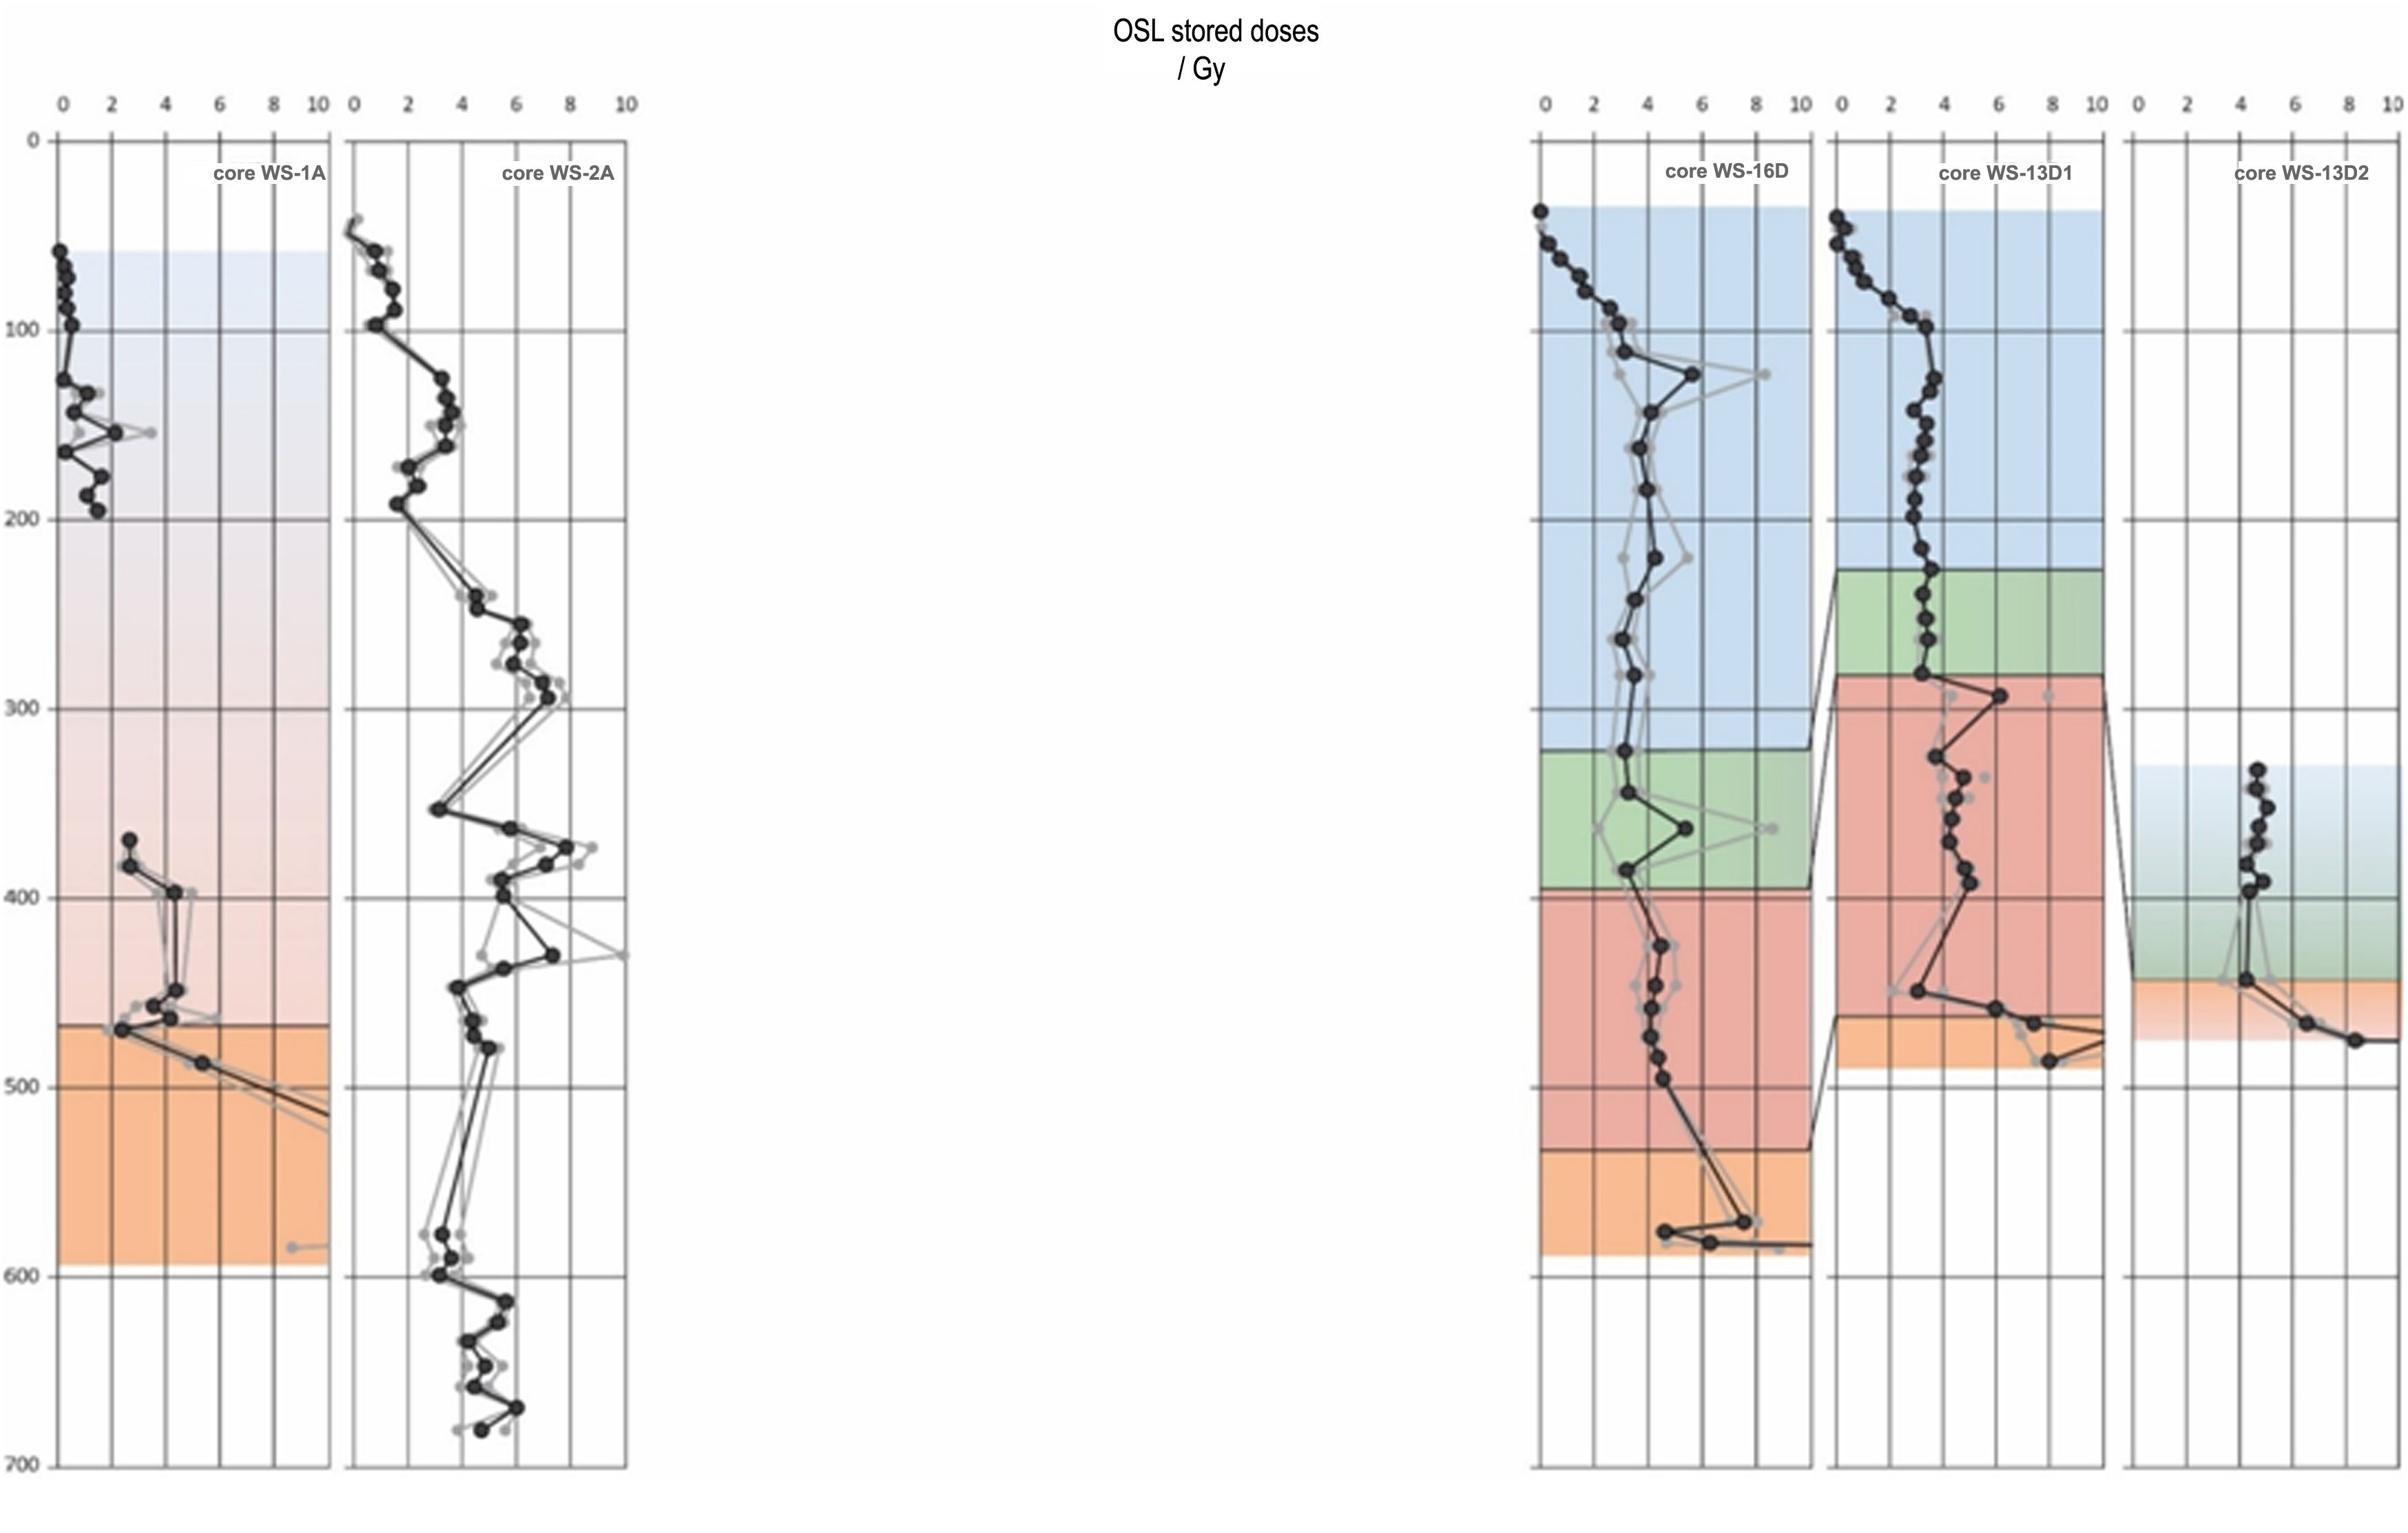
Stage 2: Calibrated OSL characterisation and sample selection. A sub-set of samples were progressed to calibrated OSL characterisation to obtain the first approximations of sensitivity (counts Gy-1) and apparent dose (Gy). In all, 145 samples were progressed from stage 1 to stage 2 (c.50 % of the sample set): 25 from WS-1A, 43 from WS-2A, 30 from WS-16D, 36 from WS-13D1 and 11 from WS-13D2. Laboratory analyses were undertaken in the luminescence laboratories of the School of Earth and Environmental Sciences, University of St Andrews.
Standard mineral preparation procedures were used to obtain HF-etched 'quartz' from these sub-samples. This involved wet-sieving to extract the 90-250 µm fraction and treatments in hydrochloric (HCl) and 40% hydrofluoric acids (HF). Paired aliquots of this 'quartz' were subjected to a simplified SAR OSL protocol (see Kinnaird et al. 2017a; 2017b; Turner et al. 2021 for the methodology). OSL measurements were carried out using a Risø TL/OSL DA-20 automated dating system, equipped with a 90Sr/90Y β-source for irradiation, blue LEDs emitting around 470nm and infrared diodes emitting around 830nm for optical stimulation (Bøtter-Jensen et al. 2003). OSL was detected through 7.5mm of Huoya U-340 filter and detected with a 9635QA photomultiplier tube. OSL measurements were made at 125°C for 60 s, with the signals integrated over the first 1 s of stimulation, minus a late background over 10 s. Data reduction and De determinations were made in Luminescence Analyst v.4.31.9 and the Luminescence package in R (Kreutzer et al. 2024). Dose response curves were fitted with an exponential function, with the growth curve fitted through zero and the repeat recycling points.
This provided estimates of apparent dose for each of the samples progressed to stage 2, which were plotted vs depth for WS-1A, WS-2A, WS-16D, WS-13D1 and WS-13D2 (Fig. 8.2). These calibrated 'profiles' were compared to the luminescence stratigraphies generated in stage 1, and if the combined results looked promising for dating purposes, samples from strategic positions in the core were progressed to dating (stage 3).
Stage 3: Quantitative quartz SAR OSL dating. The primary objective of the OSL investigation was to date the construction of the Durrington shafts/pits, with the secondary objective of obtaining a chronology for the sequence of infills.
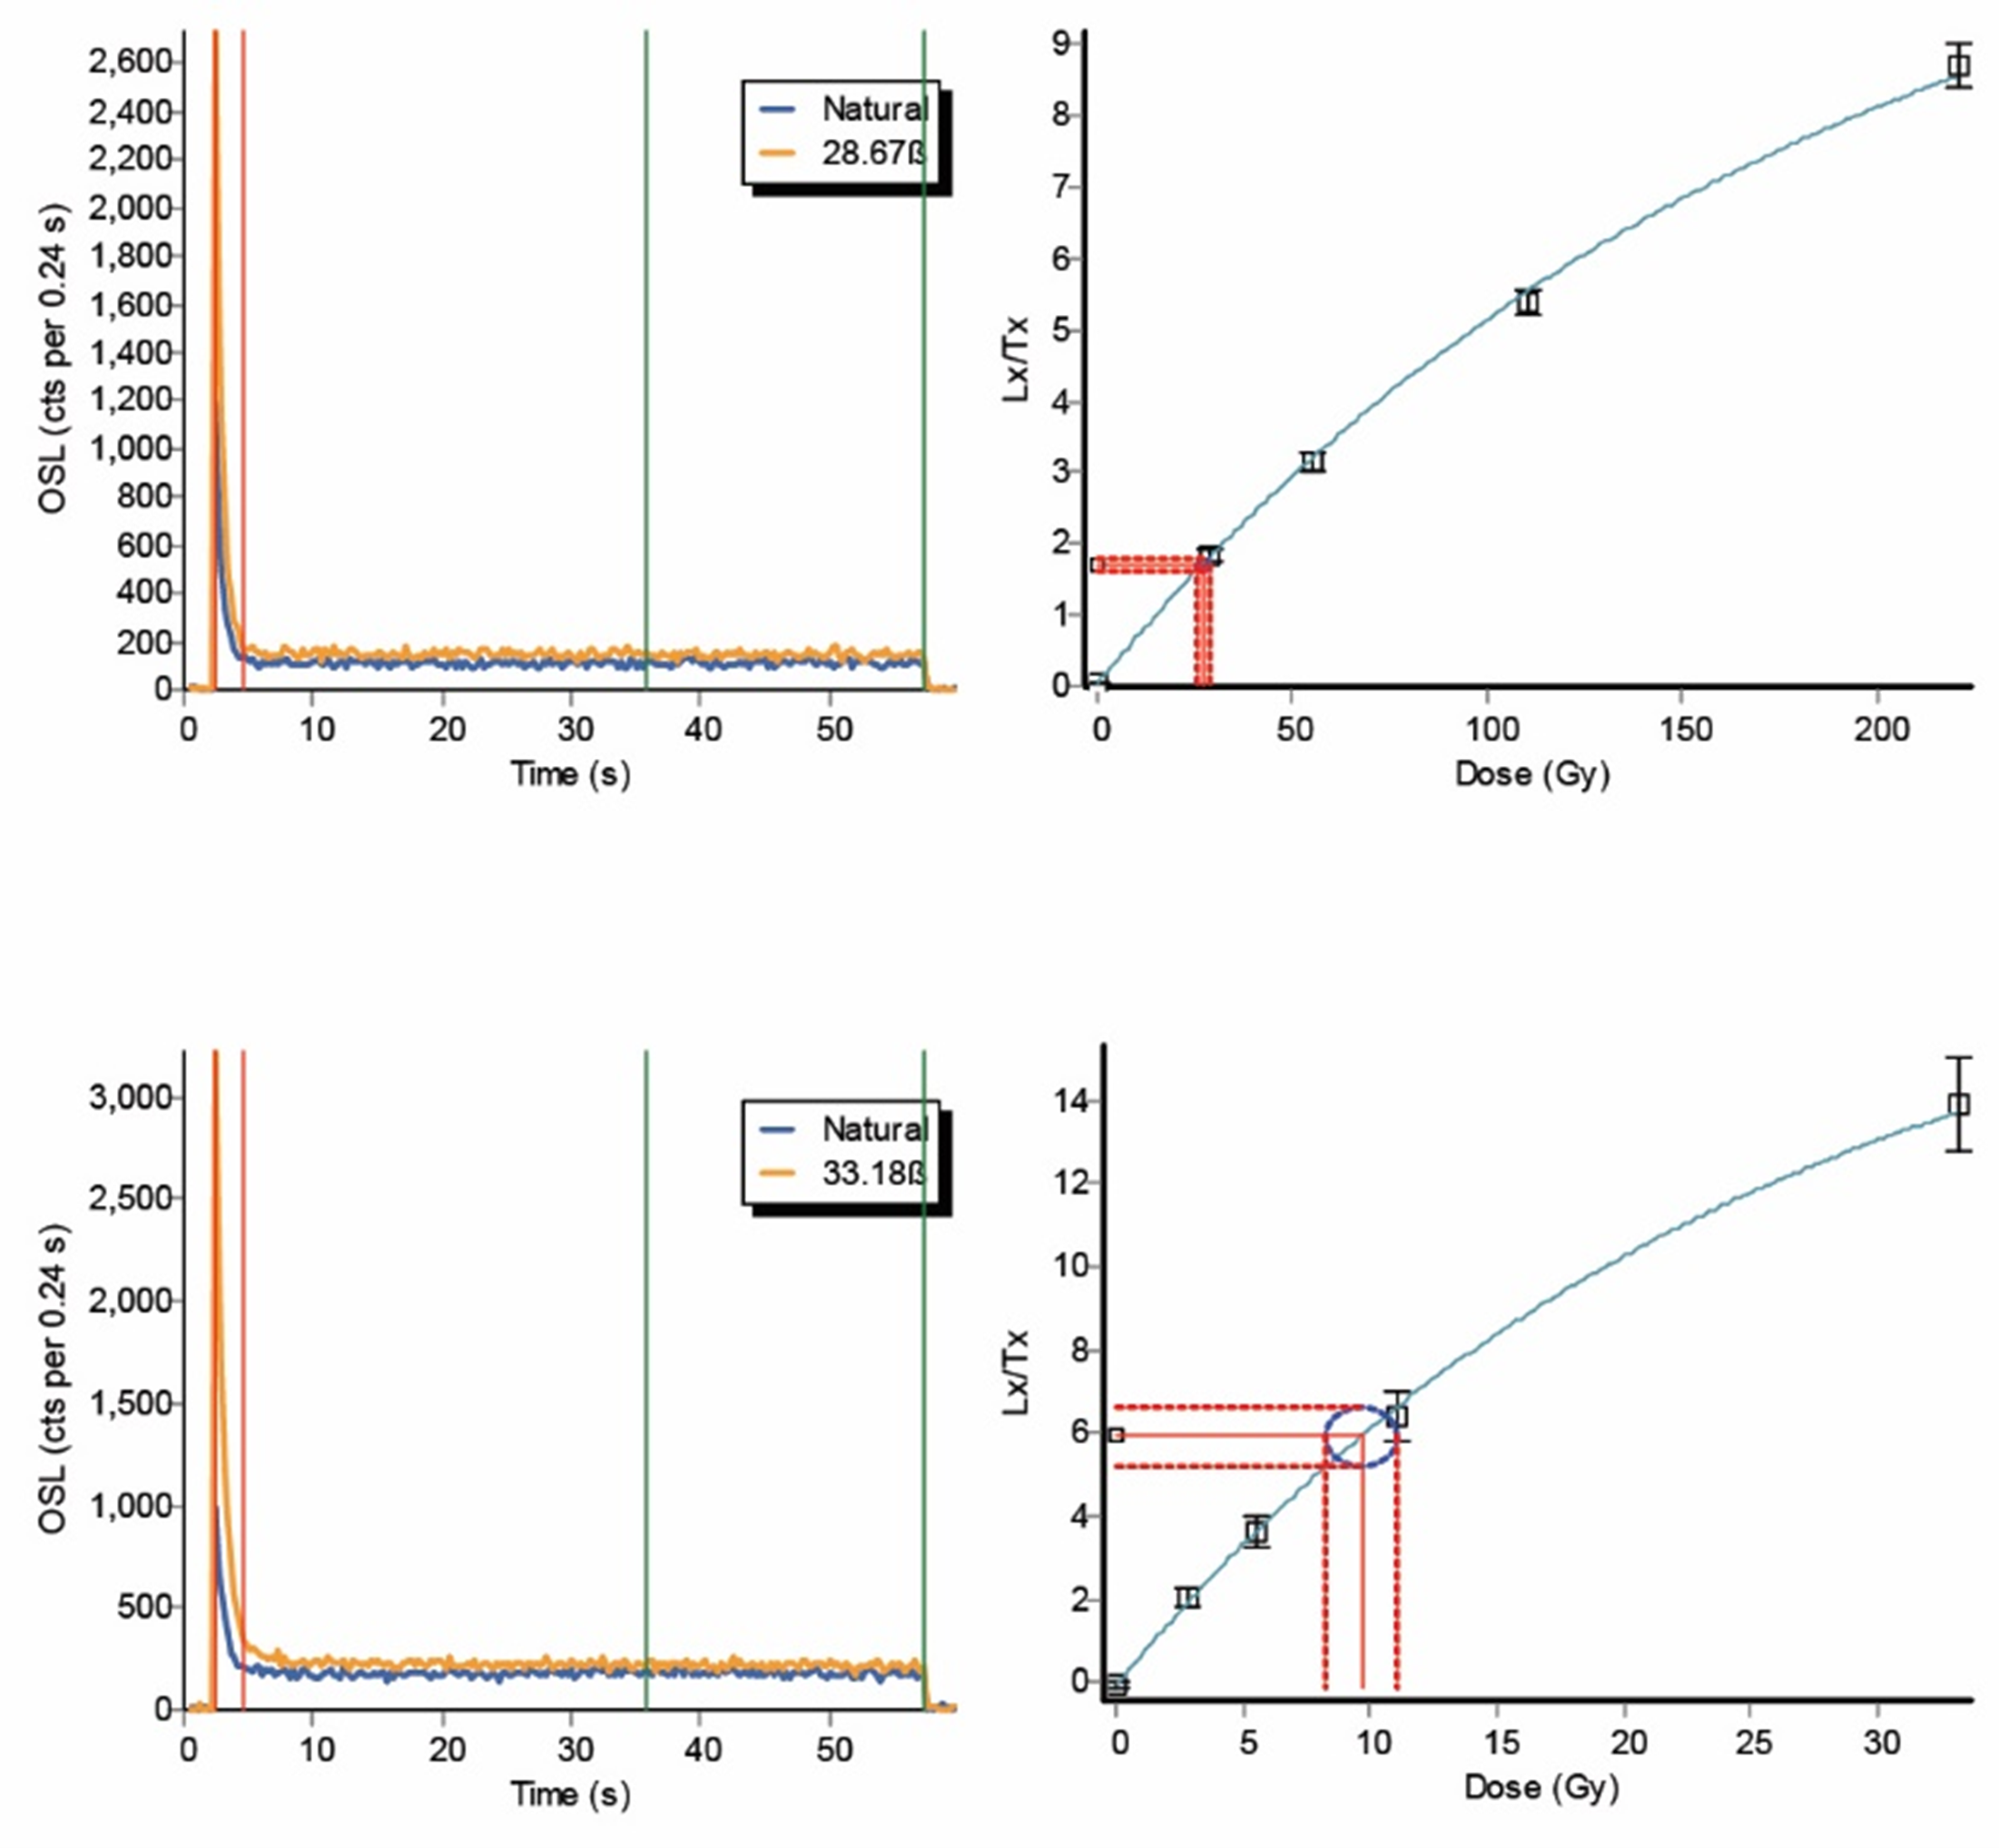
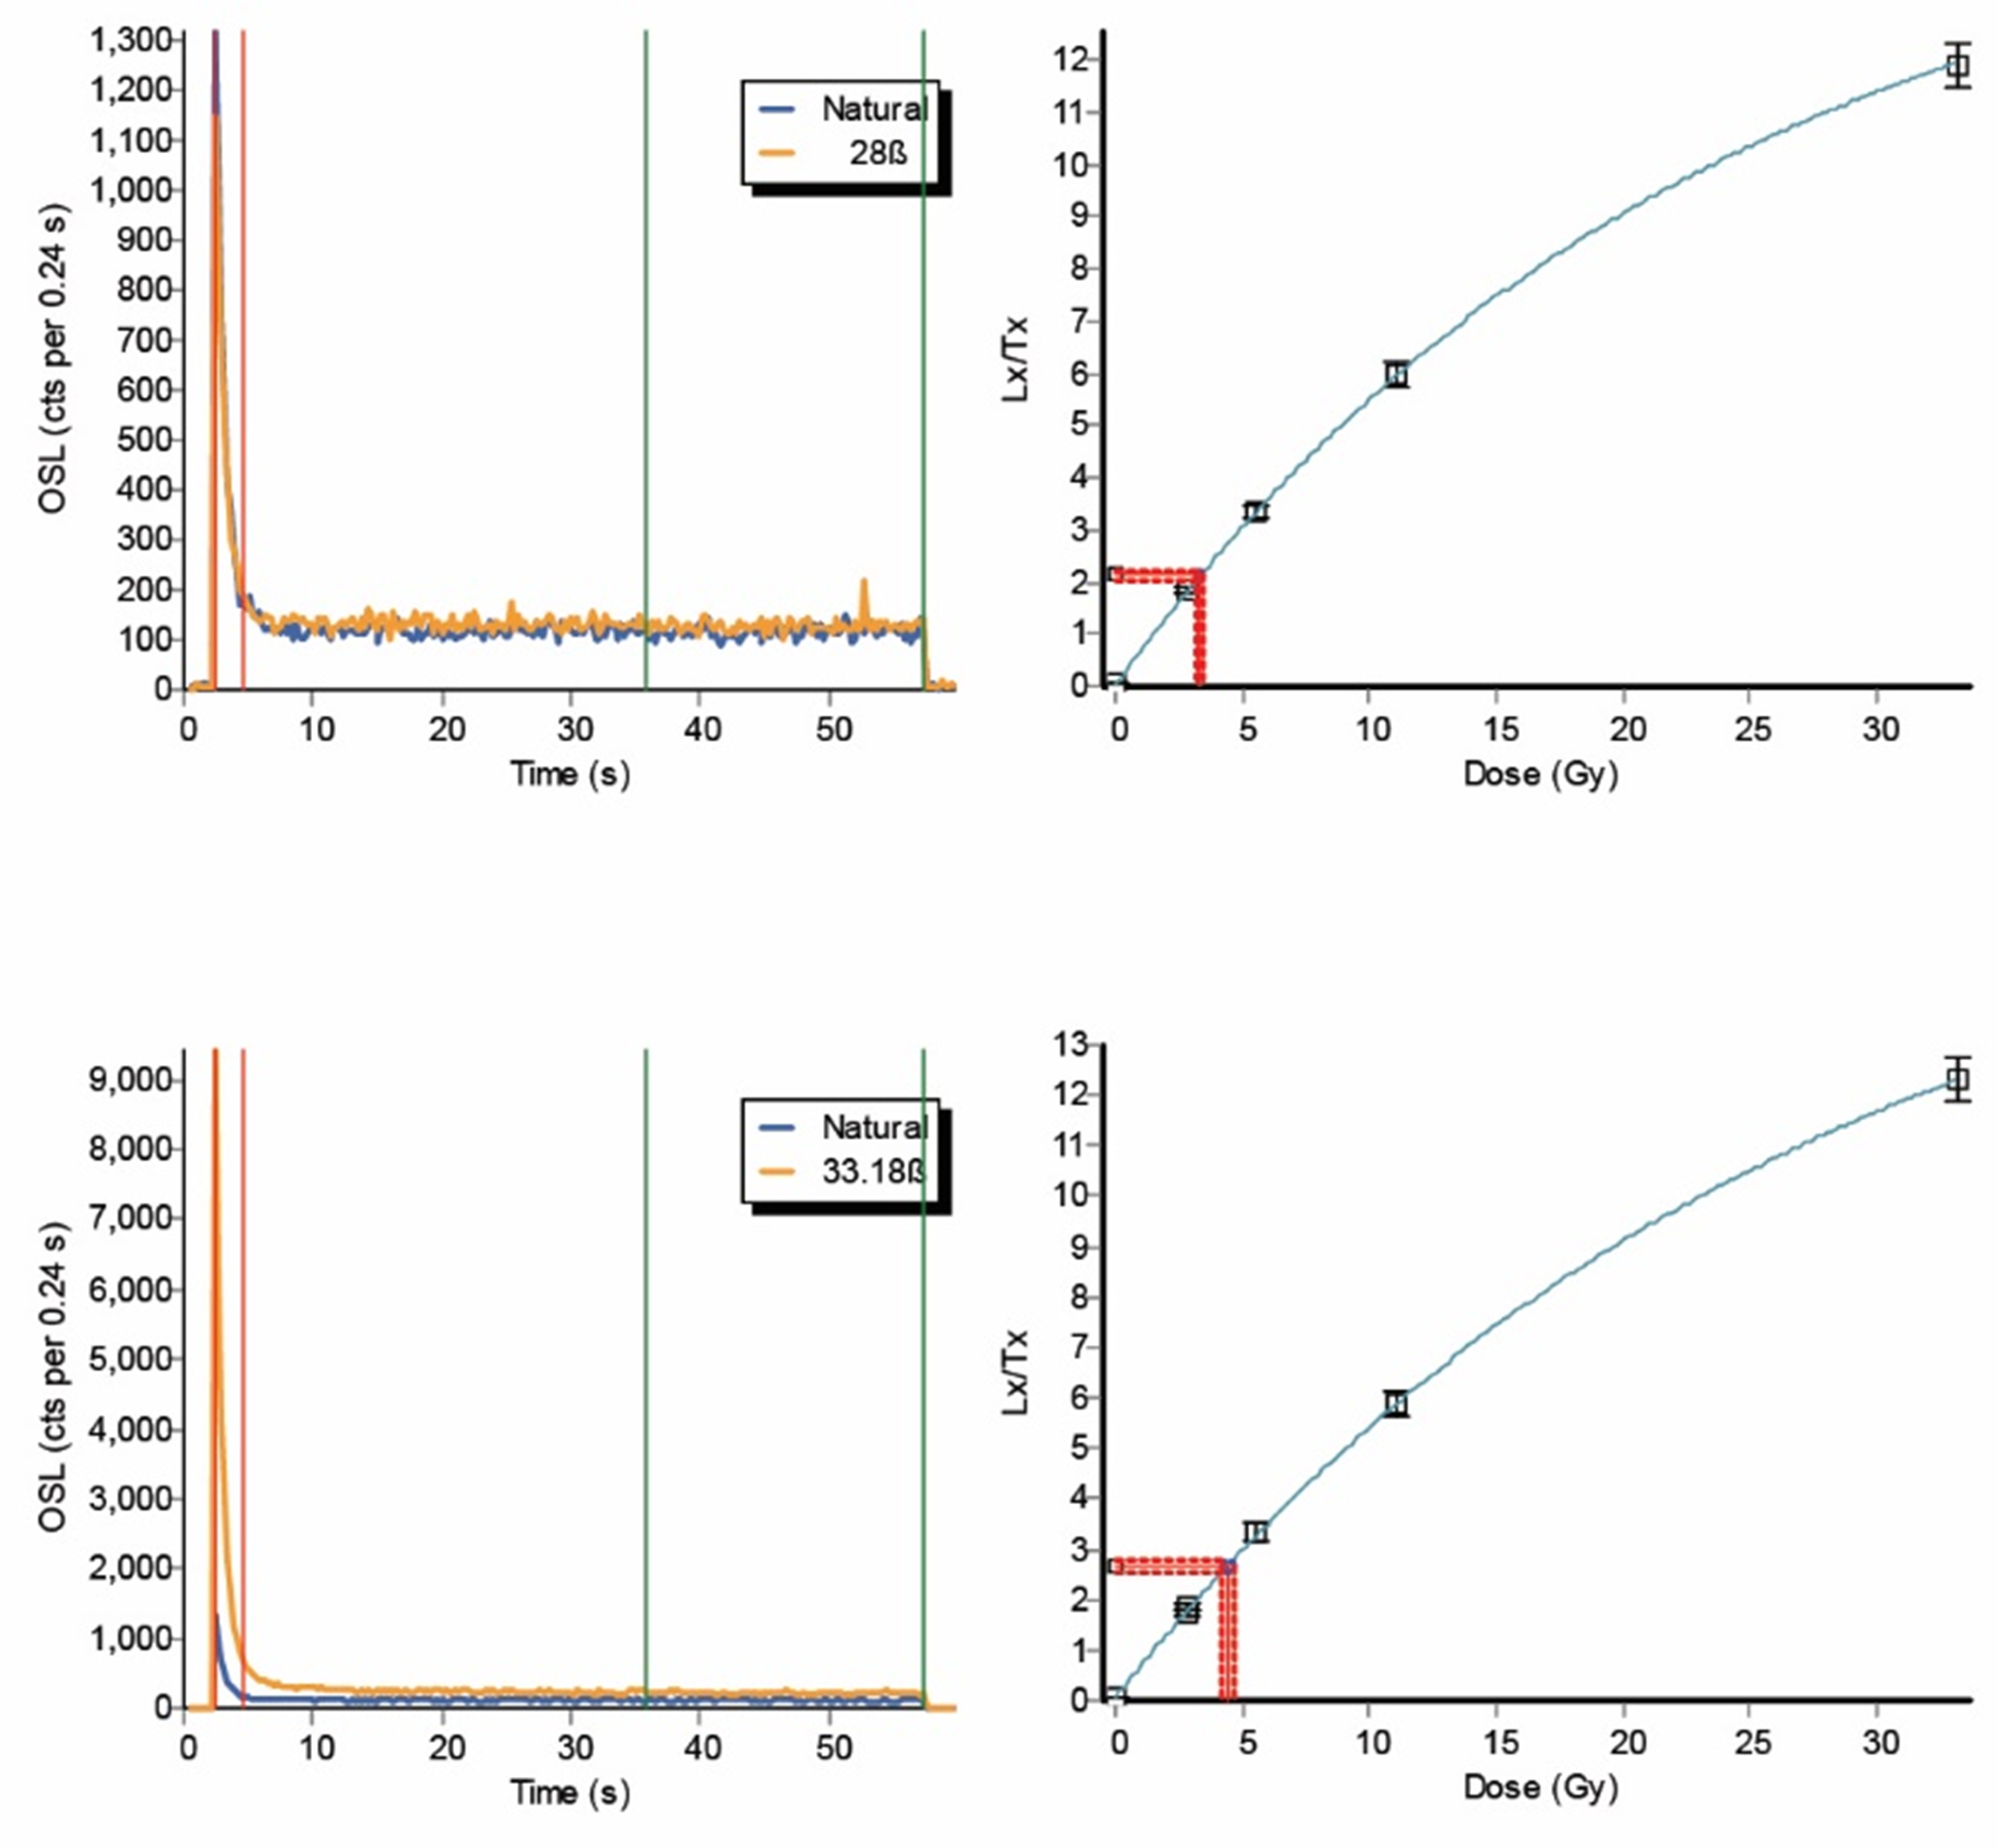
(3a) Equivalent dose determinations. The samples selected for dating were subjected to further mineral purification procedures, with treatments in HCl and hydrogen peroxide to remove carbonate and organic matter respectively, density separation in LST heavy liquid at 2.58, 2.64 and 2.74 gcm-3, etching in 40% HF for 40 minutes to remove the alpha-irradiated outer surface of the quartz grains and any persistent feldspar contamination, and a further treatment in HCl to remove any precipitated fluorides. 150-250 µm, HF-etched quartz was dispensed for measurement on stainless steel discs as small-aliquots (for CERSA585-10, -15, -27, -34, -37, -40 to -41 and -41 to -42 the 90-150 µm was used; see Table 8.1). Equivalent doses (De) determinations were made on sets of 24+ aliquots per sample determined using a quartz SAR OSL protocol (cf. Kinnaird et al. 2017a; 2017b; Murray and Wintle 2000). OSL measurements were made on the same equipment as described above. Again, OSL was measured at 125°C for 60 s, with the signals integrated over the first 1 s of stimulation, minus the late background. The regenerative dose response was constructed using regenerative doses ranging from ~2.8 to 32.4 Gy, with an additional zero dose, a repeat recycling dose (~2.8 Gy) and an IRSL recycling dose (~2.8 Gy). Dose recovery tests on samples CERSA585-27 and CERSA585-34, provided ratios of 1.00 ± 0.02 and 0.96 ± 0.04, respectively, indicating the suitability of the applied protocol. Data reduction and De determinations were made in Luminescence Analyst v.4.31.9. Dose response curves were fitted with an exponential function, with the growth curve fitted through zero and the repeat recycling points (Figs 8.3 and 8.4). Error analysis was determined by Monte Carlo Stimulation. Individual decay curves were scrutinised for shape and consistency, and only aliquots that satisfied the following criteria were accepted: (i) recuperation of less than 5 %; (ii) recycling ration within 10 % of unity; (iii) OSL IR depletion ratio (Duller, 2003) within 10% of unity; and test dose signal should be at least 3σ greater than background levels.
(3b) Equivalent dose distributions. Equivalent dose distributions are shown as Kernel Density Estimate (KDE) and Abanico plots in Figure 21 (main manuscript), and Figure 8.5 and Figure 8.6 below (Dietze et al. 2013). Different permutations of the assimilation of equivalent doses to obtain the burial dose were considered, including weighted combinations and statistical dose models (see Guérin et al. 2017). The weighted mean was used in assimilating the equivalent doses to obtain the palaeodose.
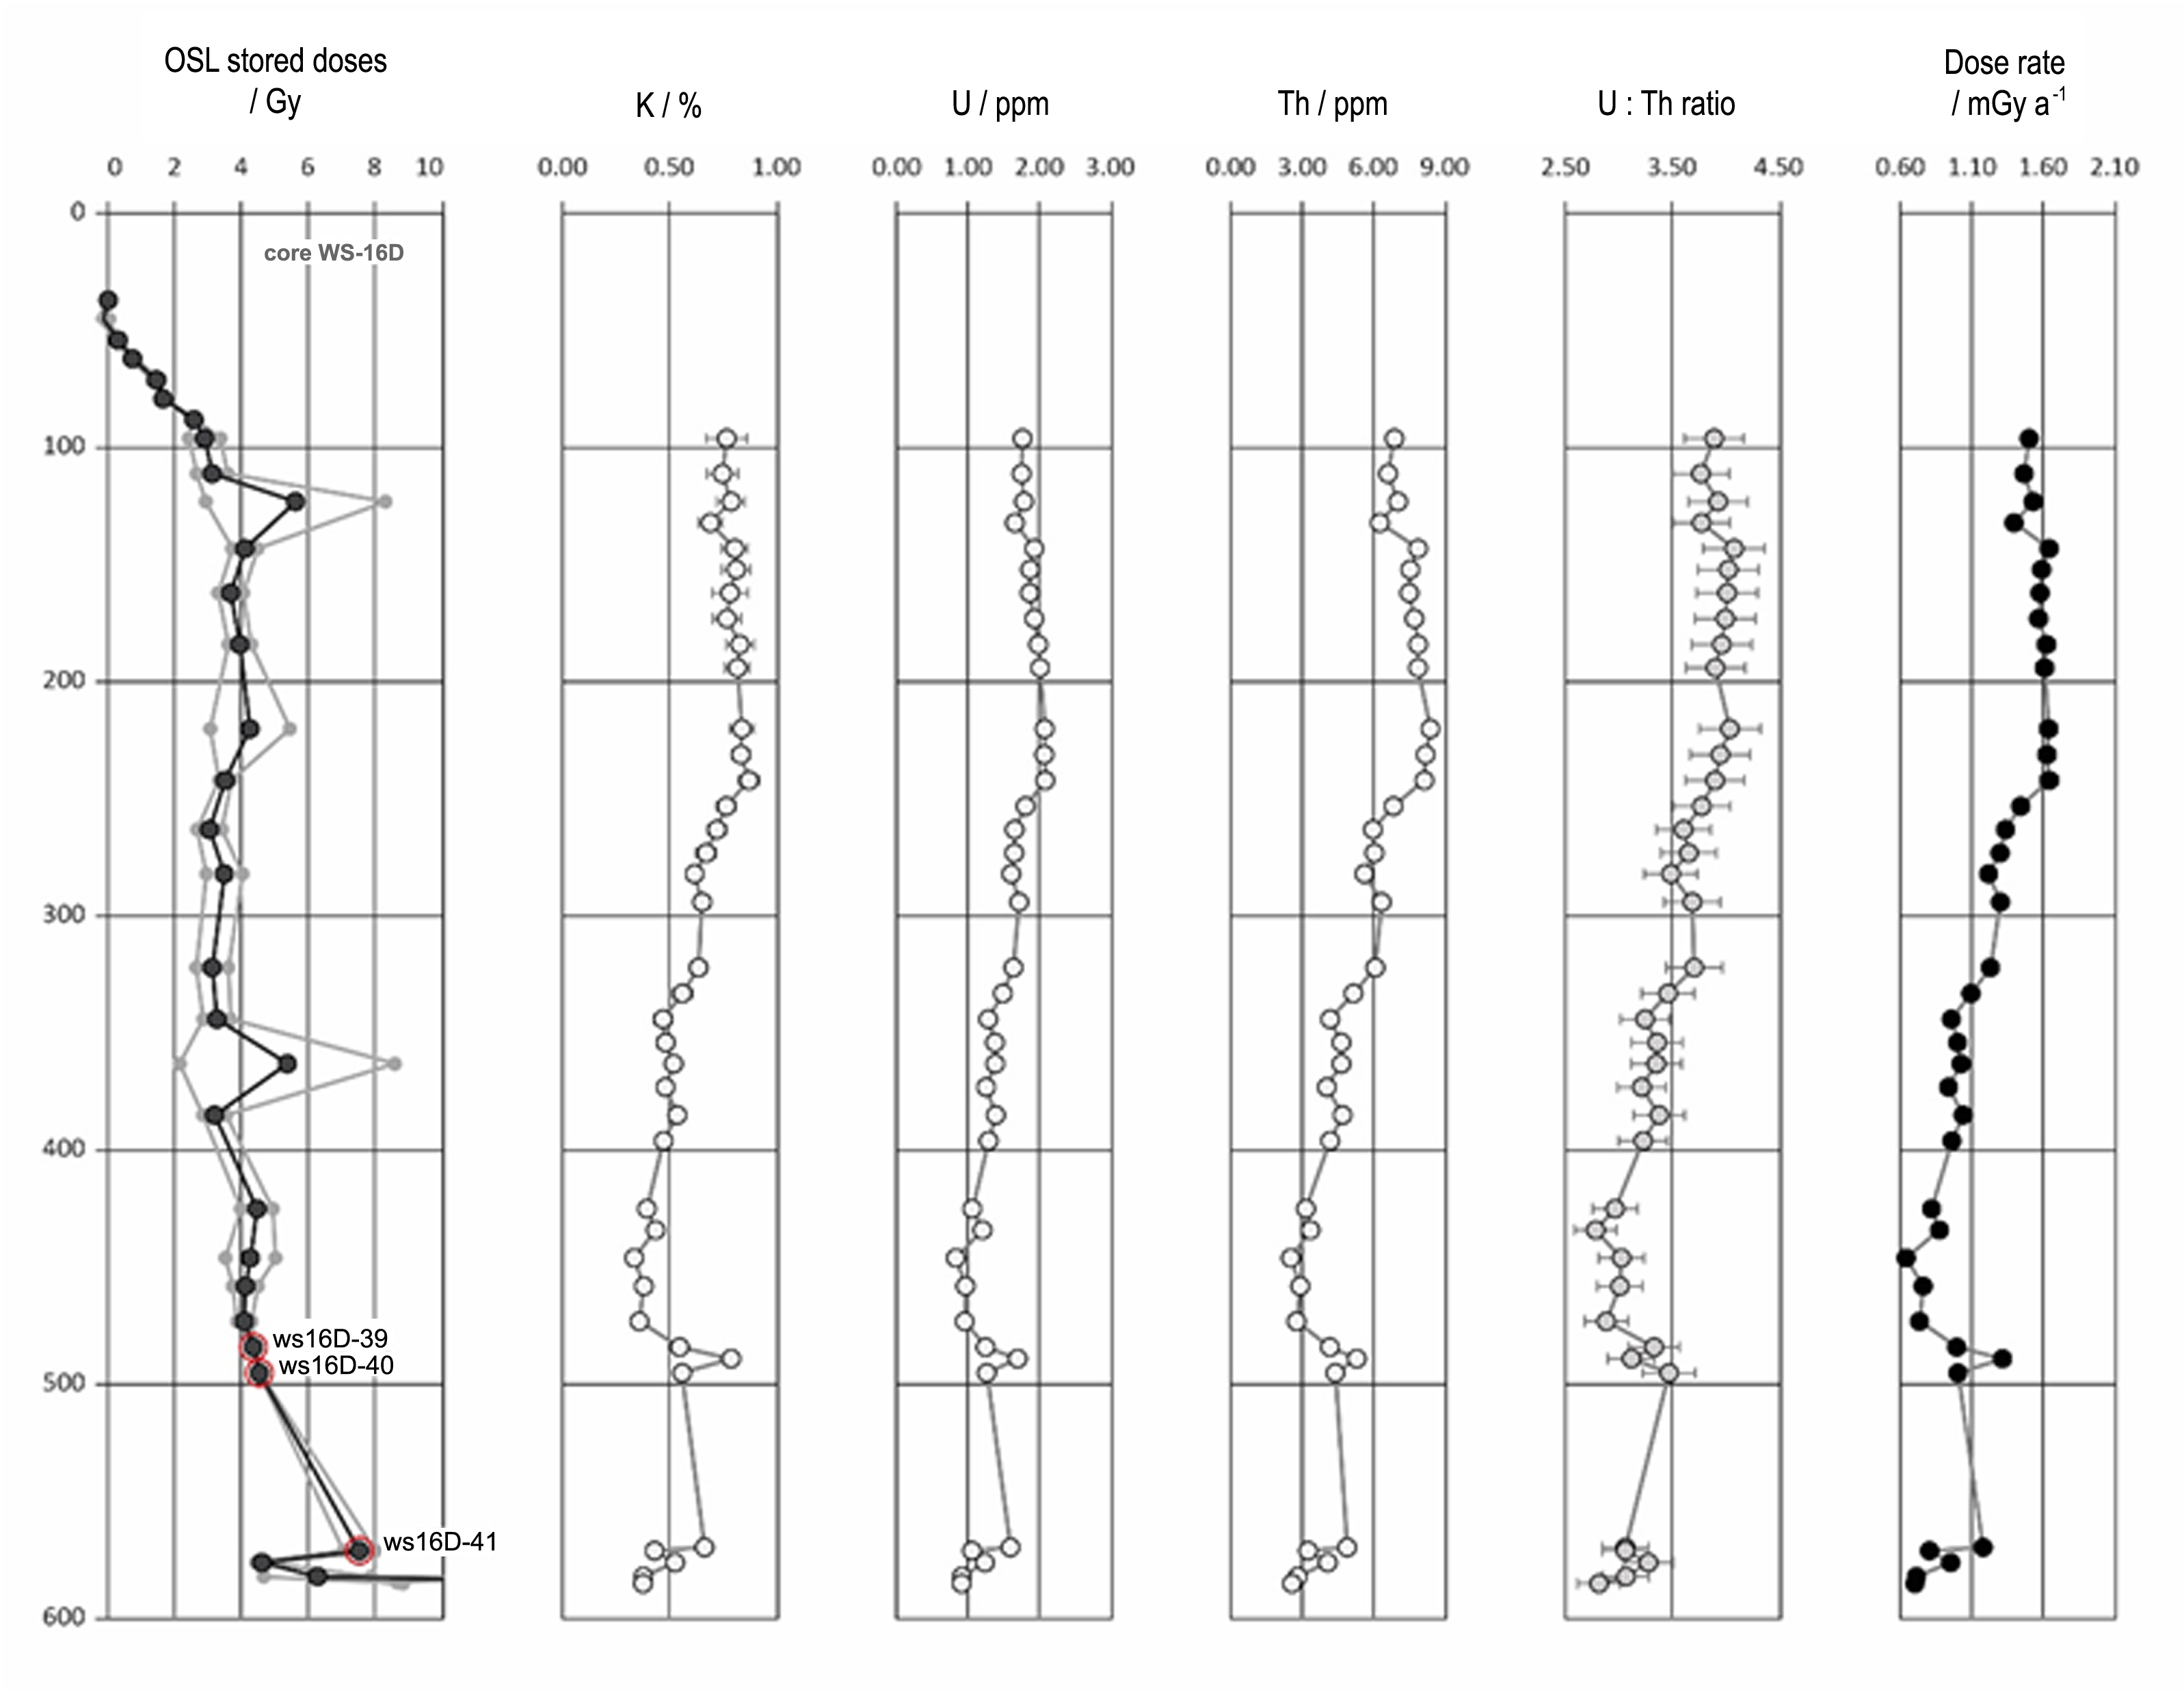
(3c) Dose rate determinations. Radionuclide concentrations of K (%), U (ppm) and Th (ppm) were determined by inductively coupled plasma optical emission spectrometry (ICP-OES, K) and inductively coupled plasma mass spectrometry (ICP-MS, U and Th) at X-Ray Mineral Services Ltd, UK. These measurements were performed on dried, homogenised sub-samples of sediment taken from the units encompassing the dating positions. 20-25g of sediment were taken from each sample, then ground and homogenised using a Tema Machinery Disc Mill. Samples were prepared for ICP analyses by using the lithium metaborate (alkali) fusion procedure, as advocated by Jarvis and Jarvis (1992a). Separate aliquots of the prepared samples were analysed using a ThermoFischer iCAP ICP-OES and ThermoFisher X-Series II ICP-MS instruments. This provided quantitative data for ten major elements (Al, Si, Ti, Fe, Mn, Mg, Ca, Na, K and P) and thirty-nine trace elements (Ba, Be, Ce, Co, Cr, Cs, Cu, Dy, Er, Ga, Gd, Eu, Hf, Ho, La, Lu, Mo, Nb, Nd, Ni, Pb, Pr, Rb, S, Sc, Sm, Sr, Ta, Tb, Tl, Th, Tm, U, V, W, Y, Yb, Zn and Zr). Major elements are reported in weight % oxide form and trace elements in parts per million (ppm). Further details are provided in SDF 7 Geochemical investigations and Chemostratigraphy. For a sub-set of the samples from core WS-16D low-level environmental radioactivity measurements were also undertaken using a MiDose Solutions µDose unit (S/N 016: Tudyka et al. 2018; Kolb et al. 2021). α and β counts, together with the pulse pairs arising from the subsequent decay chains of 214Bi/214Po, 220Rn/216Po, 212Bi/212Pi and 219Rn/215Po, are used to calculate 238U, 235U, 232Th and 40K specific activities. Three reference standards produced by the International Atomic Energy Agency (IAEA) – IAEA-RGU-1, IAEA-RGTh-1 and IAEA-RGK-1, were used to calibrate the µDose using the methodology of Tudyka et al. (2018). Sample measurements were interleaved with background measurements and measurements of the MiDose Solutions reference material, comprising equal quantities of the three reference standards. Sub-samples were presented for measurement in the same geometry as the calibration standards. Count times varied from ~ 159 ks to 281 ks.
Figure 8.7 illustrates the down-core variation in K, U and Th concentrations for WS-16D. The radionuclide concentrations were used to determine infinite matrix doses for α, γ and β radiation (Table 8.2), using the conversion factors of Guérin et al. (2011), and were adjusted for attenuation by grain-size and chemical etching using the datasets of Guérin et al. (2011) and Mejdahl (1979), respectively. When available, these dose rates were combined using weighted statistics with the dose rates measured in the MiDose Solutions µDose unit (Table 8.3). Field and saturated water contents were determined for all samples in the laboratory (~15-28% and ~23–33%, respectively) and working values of 14–30% adopted to determine effective environmental dose rates (Ḋ). The contribution from the cosmic dose was determined following Prescott and Hutton (1994), with adjustments for longitude, latitude and altitude, and the samples' depth in core. The dose rates measurements were used in combination with the assumed burial water contents to determine the total effective dose rates for age estimation (Table 8.4).
(3d) Age determinations. Luminescence ages were calculated using standard micro-dosimetric models with uncertainties that combined measurement and fitting errors from the SAR analysis, all dose rate evaluation uncertainties and allowance for the calibration uncertainties of the sources. The burial dose was determined from the weighted mean of the De distribution (the different statistical approaches for assimilating equivalent doses to obtain burial doses yielded similar values for the primary fills, within 1-4% of each other; the values showed greater divergence for the samples taken from the substrate).
| Sample ID | ICP-MS and ICP-OES | |||||
|---|---|---|---|---|---|---|
| K/% | U/ppm | Th/ppm | β dose rate, dry/mGy a-1 | γ dose rate, dry/mGy a-1 | ||
| WS-1A 187 | 0.48 ± 0.02 | 1.52 ± 0.08 | 4.98 ± 0.25 | 0.66 ± 0.02 | 0.53 ± 0.02 | |
| WS-1A 195 | 0.43 ± 0.02 | 1.45 ± 0.07 | 4.57 ± 0.23 | 0.60 ± 0.02 | 0.49 ± 0.01 | |
| WS-1A 451-455 | 0.46 ± 0.02 | 1.02 ± 0.05 | 3.02 ± 0.15 | 0.54 ± 0.02 | 0.37 ± 0.01 | |
| WS-1A 456-458 | 0.44 ± 0.02 | 1.10 ± 0.06 | 2.80 ± 0.14 | 0.52 ± 0.02 | 0.37 ± 0.01 | |
| WS-1A 458-462 | 0.16 ± 0.01 | 0.70 ± 0.04 | 1.07 ± 0.05 | 0.23 ± 0.01 | 0.17 ± 0.01 | |
| WS-1A 586-591 | 0.32 ± 0.02 | 1.50 ± 0.08 | 1.70 ± 0.09 | 0.46 ± 0.02 | 0.33 ± 0.01 | |
| WS-2A 620 | 1.14 ± 0.06 | 5.28 ± 0.26 | 8.36 ± 0.42 | 1.69 ± 0.06 | 1.27 ± 0.04 | |
| WS-2A 670-683 | 1.29 ± 0.06 | 2.50 ± 0.13 | 9.30 ± 0.47 | 1.47 ± 0.06 | 1.04 ± 0.03 | |
| WS-16D 123 | 0.79 ± 0.04 | 1.79 ± 0.09 | 7.04 ± 0.35 | 1.00 ± 0.04 | 0.73 ± 0.02 | |
| WS-16D175 | 0.77 ± 0.04 | 1.93 ± 0.10 | 7.73 ± 0.39 | 1.02 ± 0.04 | 0.78 ± 0.02 | |
| WS-16D 333 | 0.56 ± 0.03 | 1.49 ± 0.07 | 5.16 ± 0.26 | 0.74 ± 0.03 | 0.55 ± 0.02 | |
| WS-16D 344 | 0.47 ± 0.02 | 1.29 ± 0.06 | 4.18 ± 0.21 | 0.60 ± 0.02 | 0.46 ± 0.01 | |
| WS-16D 385 | 0.52 ± 0.03 | 1.39 ± 0.07 | 4.65 ± 0.23 | 0.66 ± 0.02 | 0.51 ± 0.02 | |
| WS-16D 400 | 0.40 ± 0.02 | 1.06 ± 0.05 | 3.15 ± 0.16 | 0.51 ± 0.02 | 0.37 ± 0.01 | |
| WS-16D 450 | 0.38 ± 0.02 | 0.97 ± 0.05 | 2.92 ± 0.15 | 0.48 ± 0.02 | 0.34 ± 0.01 | |
| WS-16D 484 | 0.55 ± 0.03 | 1.25 ± 0.06 | 4.17 ± 0.21 | 0.65 ± 0.02 | 0.48 ± 0.01 | |
| WS-16D 489 | 0.55 ± 0.02 | 1.26 ± 0.04 | 4.28 ± 0.15 | 0.66 ± 0.02 | 0.48 ± 0.01 | |
| WS-16D 495 | 0.56 ± 0.03 | 1.27 ± 0.06 | 4.40 ± 0.22 | 0.69 ± 0.02 | 0.49 ± 0.01 | |
| WS-16D 569 | 0.48 ± 0.02 | 1.15 ± 0.04 | 3.65 ± 0.13 | 0.58 ± 0.02 | 0.42 ± 0.01 | |
| WS-16D 571 | 0.43 ± 0.02 | 1.06 ± 0.05 | 3.24 ± 0.16 | 0.54 ± 0.02 | 0.38 ± 0.01 | |
| WS-16D 582 | 0.38 ± 0.02 | 0.92 ± 0.05 | 2.82 ± 0.14 | 0.46 ± 0.02 | 0.33 ± 0.01 | |
| WS-13D1 189 | 0.60 ± 0.03 | 1.60 ± 0.08 | 6.04 ± 0.30 | 0.78 ± 0.03 | 0.62 ± 0.02 | |
| WS-13D1 198 | 0.59 ± 0.03 | 1.67 ± 0.08 | 5.99 ± 0.30 | 0.77 ± 0.03 | 0.62 ± 0.02 | |
| WS-13D1 215 | 0.56 ± 0.03 | 1.51 ± 0.08 | 5.65 ± 0.28 | 0.73 ± 0.03 | 0.58 ± 0.02 | |
| WS-13D1 226 | 0.76 ± 0.04 | 1.98 ± 0.10 | 8.10 ± 0.41 | 0.99 ± 0.04 | 0.80 ± 0.02 | |
| WS-13D1 239 | 0.62 ± 0.03 | 1.69 ± 0.08 | 6.20 ± 0.31 | 0.80 ± 0.03 | 0.64 ± 0.02 | |
| WS-13D1 252 | 0.74 ± 0.04 | 1.95 ± 0.10 | 7.52 ± 0.38 | 0.96 ± 0.03 | 0.76 ± 0.02 | |
| WS-13D1 263 | 0.67 ± 0.03 | 1.88 ± 0.09 | 6.88 ± 0.34 | 0.88 ± 0.03 | 0.70 ± 0.02 | |
| WS-13D1 281 | 0.57 ± 0.03 | 1.47 ± 0.07 | 5.24 ± 0.26 | 0.72 ± 0.03 | 0.56 ± 0.02 | |
| WS-13D1 293 | 0.45 ± 0.02 | 1.21 ± 0.06 | 3.84 ± 0.19 | 0.57 ± 0.02 | 0.43 ± 0.01 | |
| WS-13D1 325 | 0.48 ± 0.02 | 1.24 ± 0.06 | 4.17 ± 0.21 | 0.60 ± 0.02 | 0.46 ± 0.01 | |
| WS-13D1 336 | 0.46 ± 0.02 | 1.22 ± 0.06 | 4.12 ± 0.21 | 0.58 ± 0.02 | 0.45 ± 0.01 | |
| WS-13D1 347 | 0.46 ± 0.02 | 1.25 ± 0.06 | 4.11 ± 0.21 | 0.59 ± 0.02 | 0.45 ± 0.01 | |
| WS-13D1 358 | 0.47 ± 0.02 | 1.24 ± 0.06 | 3.99 ± 0.20 | 0.59 ± 0.02 | 0.45 ± 0.01 | |
| WS-13D1 370 | 0.49 ± 0.02 | 1.25 ± 0.06 | 4.20 ± 0.21 | 0.61 ± 0.02 | 0.46 ± 0.01 | |
| WS-13D1 384 | 0.47 ± 0.02 | 1.17 ± 0.06 | 4.06 ± 0.20 | 0.59 ± 0.02 | 0.44 ± 0.01 | |
| WS-13D1 449 | 0.76 ± 0.04 | 1.88 ± 0.09 | 7.16 ± 0.36 | 0.96 ± 0.03 | 0.74 ± 0.02 | |
| WS-13D1 458 | 0.72 ± 0.04 | 1.73 ± 0.09 | 6.05 ± 0.30 | 0.89 ± 0.03 | 0.66 ± 0.02 | |
| WS-13D1 458 | 0.77 ± 0.04 | 1.76 ± 0.09 | 6.20 ± 0.31 | 0.93 ± 0.03 | 0.69 ± 0.02 | |
| WS-13D1 466 | 0.58 ± 0.03 | 1.35 ± 0.07 | 4.78 ± 0.24 | 0.70 ± 0.03 | 0.52 ± 0.02 | |
| WS-13D1 466 | 0.30 ± 0.02 | 0.87 ± 0.04 | 2.22 ± 0.11 | 0.38 ± 0.01 | 0.28 ± 0.01 | |
| WS-13D1 472 | 0.52 ± 0.03 | 1.25 ± 0.06 | 3.73 ± 0.19 | 0.62 ± 0.02 | 0.45 ± 0.01 | |
| WS-13D1 486 | 0.23 ± 0.01 | 0.76 ± 0.04 | 1.66 ± 0.08 | 0.30 ± 0.01 | 0.22 ± 0.01 | |
| WS-13D2 332-342 | 0.52 ± 0.03 | 1.17 ± 0.06 | 3.68 ± 0.18 | 0.61 ± 0.02 | 0.44 ± 0.01 | |
| WS-13D2 382-391 | 0.57 ± 0.03 | 1.24 ± 0.06 | 4.28 ± 0.21 | 0.67 ± 0.03 | 0.48 ± 0.01 | |
| WS-13D2 438-442 | 0.89 ± 0.04 | 2.00 ± 0.10 | 6.30 ± 0.32 | 1.05 ± 0.04 | 0.75 ± 0.02 | |
| WS-13D2 463-465 | 0.81 ± 0.04 | 1.80 ± 0.09 | 5.60 ± 0.28 | 0.95 ± 0.04 | 0.67 ± 0.02 | |
| WS-13D2 478-482 | 0.57 ± 0.03 | 1.50 ± 0.08 | 4.10 ± 0.21 | 0.70 ± 0.03 | 0.51 ± 0.01 | |
| Sample ID | uDose, α and β counting | weighted combination | |||
|---|---|---|---|---|---|
| β dose rate, dry/mGy a-1 | γ dose rate, dry/mGy a-1 | β dose rate, dry/mGy a-1 | γ dose rate, dry/mGy a-1 | ||
| WS-16D 123 | 1.18 ± 0.06 | 0.90 ± 0.04 | 1.05 ± 0.03 | 0.78 ± 0.02 | |
| WS-16D 175 | 1.26 ± 0.06 | 0.95 ± 0.03 | 1.08 ± 0.03 | 0.83 ± 0.02 | |
| WS-16D 333 | 0.76 ± 0.05 | 0.59 ± 0.03 | 0.75 ± 0.02 | 0.56 ± 0.01 | |
| WS-16D 400 | 0.74 ± 0.05 | 0.56 ± 0.03 | 0.54 ± 0.05 | 0.39 ± 0.01 | |
| WS-16D 450 | 0.71 ± 0.05 | 0.48 ± 0.03 | 0.51 ± 0.02 | 0.36 ± 0.01 | |
| WS-16D 489 | 0.91 ± 0.06 | 0.64 ± 0.08 | 0.68 ± 0.02 | 0.49 ± 0.01 | |
| WS-16D 495 | 0.94 ± 0.06 | 0.67 ± 0.03 | 0.74 ± 0.02 | 0.52 ± 0.01 | |
| WS-16D 569 | 0.80 ± 0.05 | 0.58 ± 0.08 | 0.59 ± 0.01 | 0.42 ± 0.01 | |
| WS-16D 582 | 0.59 ± 0.05 | 0.30 ± 0.02 | 0.47 ± 0.02 | 0.32 ± 0.01 | |
| Sample ID | Water/% | Effective dose rates | |||
|---|---|---|---|---|---|
| Cosmic dose/mGy a-1 | β dose rate/mGy a-1 | γ dose rate/mGy a-1 | Total dose rate/mGy a-1 | ||
| WS-1A 187 | 27 ± 4 | 0.15 ± 0.01 | 0.50 ± 0.03 | 0.39 ± 0.04 | 1.04 ± 0.05 |
| WS-1A 195 | 25 ± 4 | 0.14 ± 0.01 | 0.47 ± 0.02 | 0.39 ± 0.04 | 1.00 ± 0.05 |
| WS-1A 451-455 | 23 ± 5 | 0.10 ± 0.01 | 0.43 ± 0.02 | 0.23 ± 0.04 | 0.76 ± 0.05 |
| WS-1A 456-458 | 26 ± 5 | 0.10 ± 0.01 | 0.41 ± 0.02 | 0.20 ± 0.03 | 0.71 ± 0.04 |
| WS-1A 458-462 | 26 ± 5 | 0.10 ± 0.01 | 0.18 ± 0.01 | 0.19 ± 0.03 | 0.47 ± 0.04 |
| WS-1A 586-591 | 23 ± 5 | 0.09 ± 0.01 | 0.37 ± 0.02 | 0.26 ± 0.05 | 0.71 ± 0.06 |
| WS-2A 620 | 31 ± 5 | 0.09 ± 0.01 | 1.25 ± 0.07 | 0.94 ± 0.05 | 2.28 ± 0.08 |
| WS-2A 670-683 | 30 ± 4 | 0.08 ± 0.01 | 1.10 ± 0.060 | 0.78 ± 0.05 | 1.96 ± 0.08 |
| WS-16D 123 | 23 ± 5 | 0.16 ± 0.02 | 0.85 ± 0.04 | 0.63 ± 0.04 | 1.63 ± 0.05 |
| WS-16D 175 | 23 ± 5 | 0.15 ± 0.01 | 0.88 ± 0.04 | 0.67 ± 0.04 | 1.69 ± 0.05 |
| WS-16D 333 | 29 ± 6 | 0.12 ± 0.01 | 0.57 ± 0.03 | 0.41 ± 0.04 | 1.10 ± 0.05 |
| WS-16D 344 | 26 ± 5 | 0.12 ± 0.01 | 0.47 ± 0.03 | 0.38 ± 0.04 | 0.95 ± 0.06 |
| WS-16D 385 | 27 ± 5 | 0.11 ± 0.01 | 0.51 ± 0.03 | 0.37 ± 0.05 | 0.98 ± 0.06 |
| WS-16D 400 | 21 ± 4 | 0.11 ± 0.01 | 0.45 ± 0.02 | 0.33 ± 0.04 | 0.89 ± 0.04 |
| WS-16D 450 | 23 ± 5 | 0.10 ± 0.01 | 0.42 ± 0.02 | 0.3 ± 0.04 | 0.82 ± 0.05 |
| WS-16D 484 | 25 ± 5 | 0.10 ± 0.01 | 0.51 ± 0.03 | 0.38 ± 0.03 | 0.98 ± 0.05 |
| WS-16D 489 | 25 ± 5 | 0.10 ± 0.01 | 0.56 ± 0.02 | 0.39 ± 0.03 | 1.04 ± 0.04 |
| WS-16D 495 | 27 ± 5 | 0.10 ± 0.01 | 0.58 ± 0.03 | 0.4 ± 0.03 | 1.08 ± 0.04 |
| WS-16D 569 | 27 ± 5 | 0.09 ± 0.01 | 0.48 ± 0.02 | 0.3 ± 0.03 | 0.87 ± 0.04 |
| WS-16D 571 | 25 ± 5 | 0.09 ± 0.01 | 0.42 ± 0.02 | 0.3 ± 0.03 | 0.81 ± 0.04 |
| WS-16D 582 | 26 ± 5 | 0.09 ± 0.01 | 0.37 ± 0.02 | 0.3 ± 0.03 | 0.76 ± 0.04 |
| WS-13D1 189 | 24 ± 5 | 0.15 ± 0.01 | 0.61 ± 0.04 | 0.48 ± 0.04 | 1.24 ± 0.06 |
| WS-13D1 198 | 26 ± 5 | 0.14 ± 0.01 | 0.6 ± 0.04 | 0.47 ± 0.04 | 1.22 ± 0.06 |
| WS-13D1 215 | 37 ± 7 | 0.14 ± 0.01 | 0.52 ± 0.04 | 0.45 ± 0.05 | 1.11 ± 0.06 |
| WS-13D1 226 | 33 ± 7 | 0.14 ± 0.01 | 0.72 ± 0.05 | 0.52 ± 0.05 | 1.38 ± 0.07 |
| WS-13D1 239 | 30 ± 6 | 0.14 ± 0.01 | 0.60 ± 0.04 | 0.5 ± 0.04 | 1.24 ± 0.06 |
| WS-13D1 252 | 30 ± 6 | 0.13 ± 0.01 | 0.72 ± 0.05 | 0.53 ± 0.04 | 1.39 ± 0.06 |
| WS-13D1 263 | 31 ± 6 | 0.13 ± 0.01 | 0.65 ± 0.04 | 0.5 ± 0.05 | 1.29 ± 0.06 |
| WS-13D1 281 | 29 ± 6 | 0.13 ± 0.01 | 0.54 ± 0.03 | 0.41 ± 0.05 | 1.08 ± 0.06 |
| WS-13D1 293 | 27 ± 5 | 0.13 ± 0.01 | 0.44 ± 0.03 | 0.35 ± 0.05 | 0.92 ± 0.05 |
| WS-13D1 325 | 19 ± 4 | 0.12 ± 0.01 | 0.49 ± 0.03 | 0.36 ± 0.04 | 0.98 ± 0.05 |
| WS-13D1 336 | 37 ± 7 | 0.12 ± 0.01 | 0.41 ± 0.03 | 0.34 ± 0.04 | 0.87 ± 0.05 |
| WS-13D1 347 | 26 ± 5 | 0.12 ± 0.01 | 0.45 ± 0.03 | 0.35 ± 0.04 | 0.92 ± 0.05 |
| WS-13D1 358 | 25 ± 5 | 0.12 ± 0.01 | 0.46 ± 0.03 | 0.35 ± 0.04 | 0.93 ± 0.05 |
| WS-13D1 370 | 27 ± 5 | 0.12 ± 0.01 | 0.47 ± 0.03 | 0.35 ± 0.04 | 0.94 ± 0.05 |
| WS-13D1 384 | 28 ± 6 | 0.11 ± 0.01 | 0.44 ± 0.03 | 0.34 ± 0.05 | 0.90 ± 0.06 |
| WS-13D1 449 | 28 ± 6 | 0.1 ± 0.01 | 0.73 ± 0.05 | 0.44 ± 0.04 | 1.27 ± 0.06 |
| WS-13D1 458 | 28 ± 6 | 0.1 ± 0.01 | 0.67 ± 0.04 | 0.39 ± 0.03 | 1.17 ± 0.05 |
| WS-13D1 458 | 28 ± 6 | 0.1 ± 0.01 | 0.7 ± 0.04 | 0.39 ± 0.03 | 1.20 ± 0.05 |
| WS-13D1 466 | 19 ± 4 | 0.1 ± 0.01 | 0.58 ± 0.03 | 0.33 ± 0.03 | 1.01 ± 0.04 |
| WS-13D1 466 | 19 ± 4 | 0.1 ± 0.01 | 0.31 ± 0.02 | 0.33 ± 0.03 | 0.74 ± 0.03 |
| WS-13D1 472 | 19 ± 4 | 0.1 ± 0.01 | 0.51 ± 0.03 | 0.32 ± 0.03 | 0.94 ± 0.04 |
| WS-13D1 486 | 22 ± 4 | 0.1 ± 0.01 | 0.24 ± 0.01 | 0.22 ± 0.04 | 0.56 ± 0.04 |
| WS-13D2 332-342 | 26 ± 5 | 0.12 ± 0.01 | 0.47 ± 0.03 | 0.33 ± 0.05 | 0.92 ± 0.06 |
| WS-13D2 382-391 | 27 ± 5 | 0.11 ± 0.01 | 0.52 ± 0.03 | 0.37 ± 0.05 | 1.00 ± 0.06 |
| WS-13D2 438-442 | 18 ± 4 | 0.11 ± 0.01 | 0.87 ± 0.05 | 0.60 ± 0.04 | 1.58 ± 0.06 |
| WS-13D2 463-465 | 22 ± 4 | 0.10 ± 0.01 | 0.76 ± 0.04 | 0.52 ± 0.04 | 1.38 ± 0.06 |
| WS-13D2 478-482 | 15 ± 3 | 0.10 ± 0.01 | 0.60 ± 0.03 | 0.45 ± 0.04 | 1.15 ± 0.05 |
Internet Archaeology is an open access journal based in the Department of Archaeology, University of York. Except where otherwise noted, content from this work may be used under the terms of the Creative Commons Attribution 3.0 (CC BY) Unported licence, which permits unrestricted use, distribution, and reproduction in any medium, provided that attribution to the author(s), the title of the work, the Internet Archaeology journal and the relevant URL/DOI are given.
Terms and Conditions | Legal Statements | Privacy Policy | Cookies Policy | Citing Internet Archaeology
Internet Archaeology content is preserved for the long term with the Archaeology Data Service (ROR). Help sustain and support open access publication by donating to our Open Access Archaeology Fund.
 Home
Home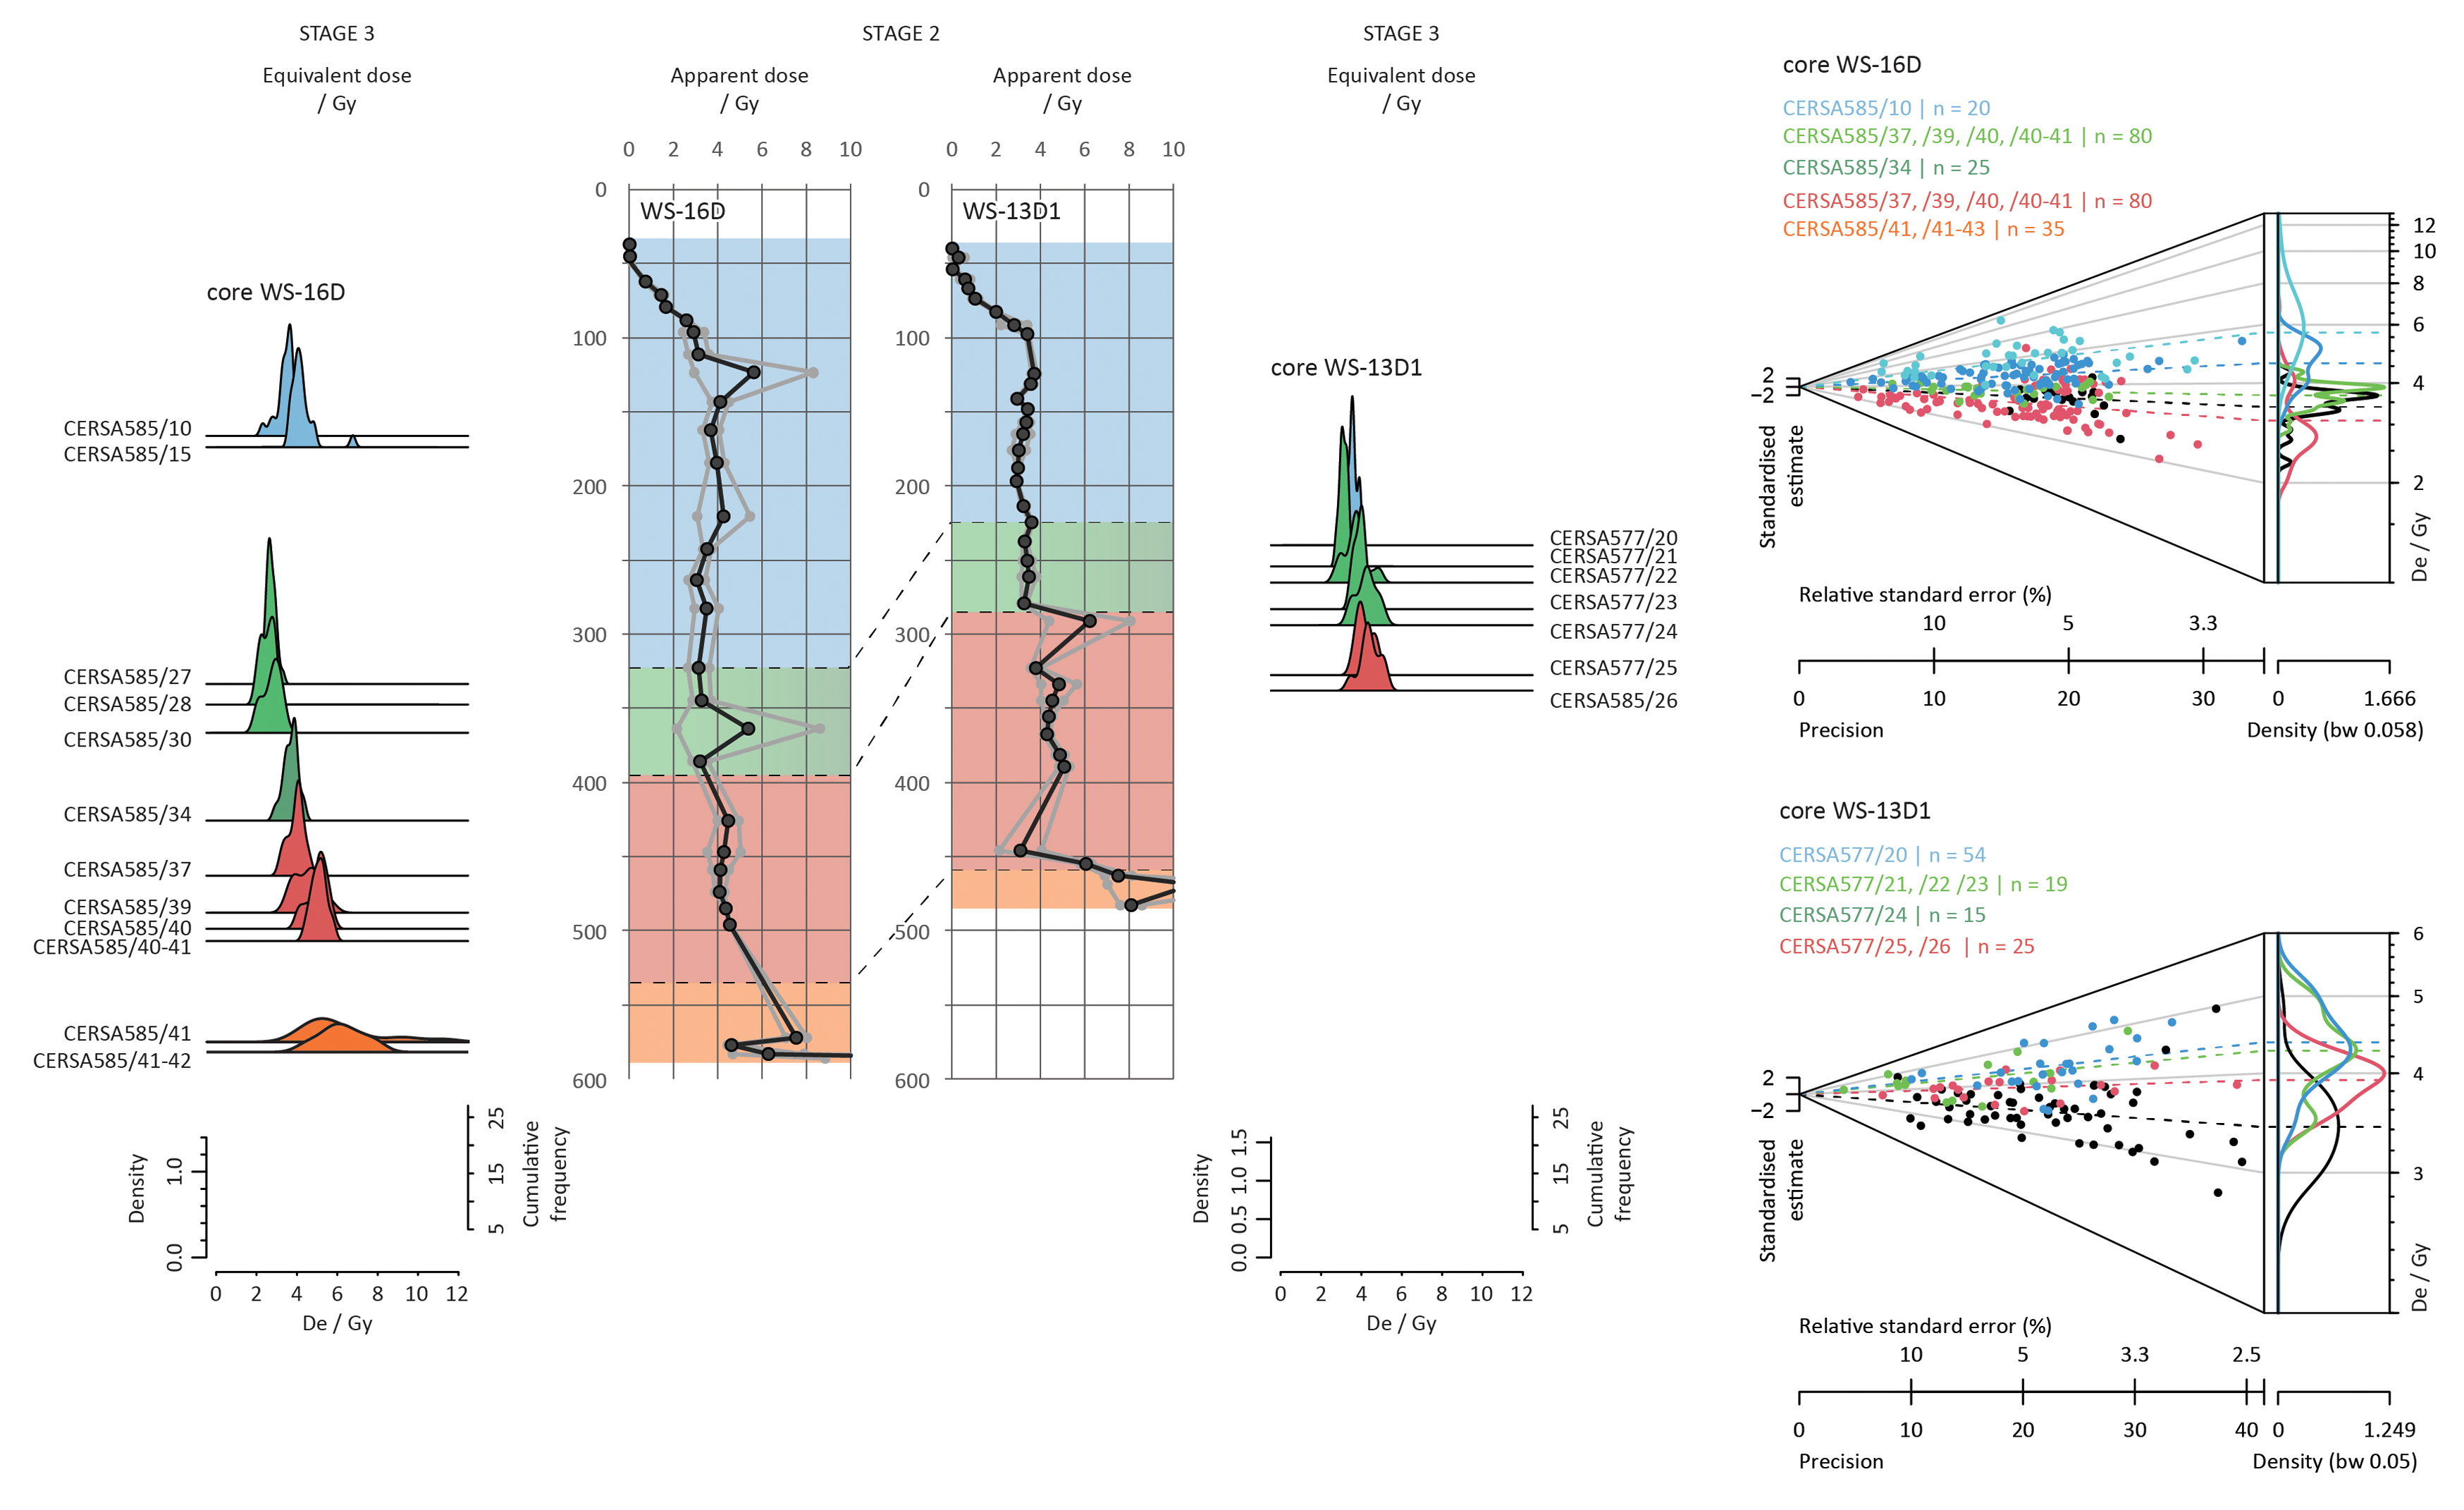