Cite this as: Gaffney, V., Baldwin, E., Allaby, R., Bates, M., Bates, R., Finlay, A., Gaffney, C., Hansford, T., Kinnaird, T., Neubauer, W., Löcker, K., Sparrow, T., Trinks, I., Wallner, M. and Ch’ng, E. 2025 The Perils of Pits: further research at Durrington Walls henge (2021-2025), Internet Archaeology 69. https://doi.org/10.11141/ia.69.19
Ground-penetrating radar surveys were undertaken with Mala GeoScience X3M single-channel systems over 1A, 2A, 3A and 13D and 16D (formerly Anomaly v), see Table 2.1. Cart-mounted 250MHz antennae with integrated odometers were controlled via X3M Ramac control units and XVII monitors. All survey grids (30m x 30m) were located to OSGB36 (15) with a DGPS unit (Leica GS16 GNSS Rover). Due to GPS signal quality on the day of grid set-out, the centre of each survey grid was off-set by c. -1.9m to the SSW. Post-survey, all survey grids and borehole locations were recorded with full DGPS signal accurate to ±2cm.
| Fieldwork 2021 – Mala GeoScience X3M single-channel GPR system | ||||||
| ID | Survey | Size | MHz | Transects | No. | Sampling |
|---|---|---|---|---|---|---|
| 1A | Area | 30m x 30m | 250 | N–S | 61 | 0.5m x 0.05m |
| 2A | Area | 30m x 30m | 250 | N–S | 120 | 0.25m x 0.05m |
| 3A | Area | 30m x 30m | 250 | N–S | 120 | 0.25m x 0.05m |
| 13D | Area | 30m x 30m | 250 | E–W | 61 | 0.5m x 0.05m |
| 16D (v) | Area | 30m x 30m | 250 | E–W | 61 | 0.5 x 0.05m |
Raw data were downloaded, positioned and processed using GPR-Slice processing software. This was also utilised to generate profiles (radargrams) and depth-slice images (time slices). All images were located to grid outlines fixed by DGPS in real world coordinates.
Radargram profiles were produced following minimal processing including time-zeroing and background filter removal. Signal velocity was set according to calculations from hyperbola testing of selected radargrams. Further processing was employed to enhance the signal where necessary, including the use of bandpass filters, deconvolution and migration. Time slices were produced at 10cm depth intervals from radargrams processed with backgrounds filters, migration process and Hilbert transforms.
This feature was originally mapped magnetically by Wessex Archaeology in 2015 and identified as a sink hole (Schmidt and Crabb 2017, anomaly 6016). It was subsequently reinterpreted as a probable pit by Gaffney et al. (2020, Anomaly 13D). As the location of 13D was only available to the current project from PDF reports, it was resurveyed with a fluxgate gradiometer in 2021 solely to locate the feature accurately for the purpose of positioning the GPR, EM and ERT survey grids.
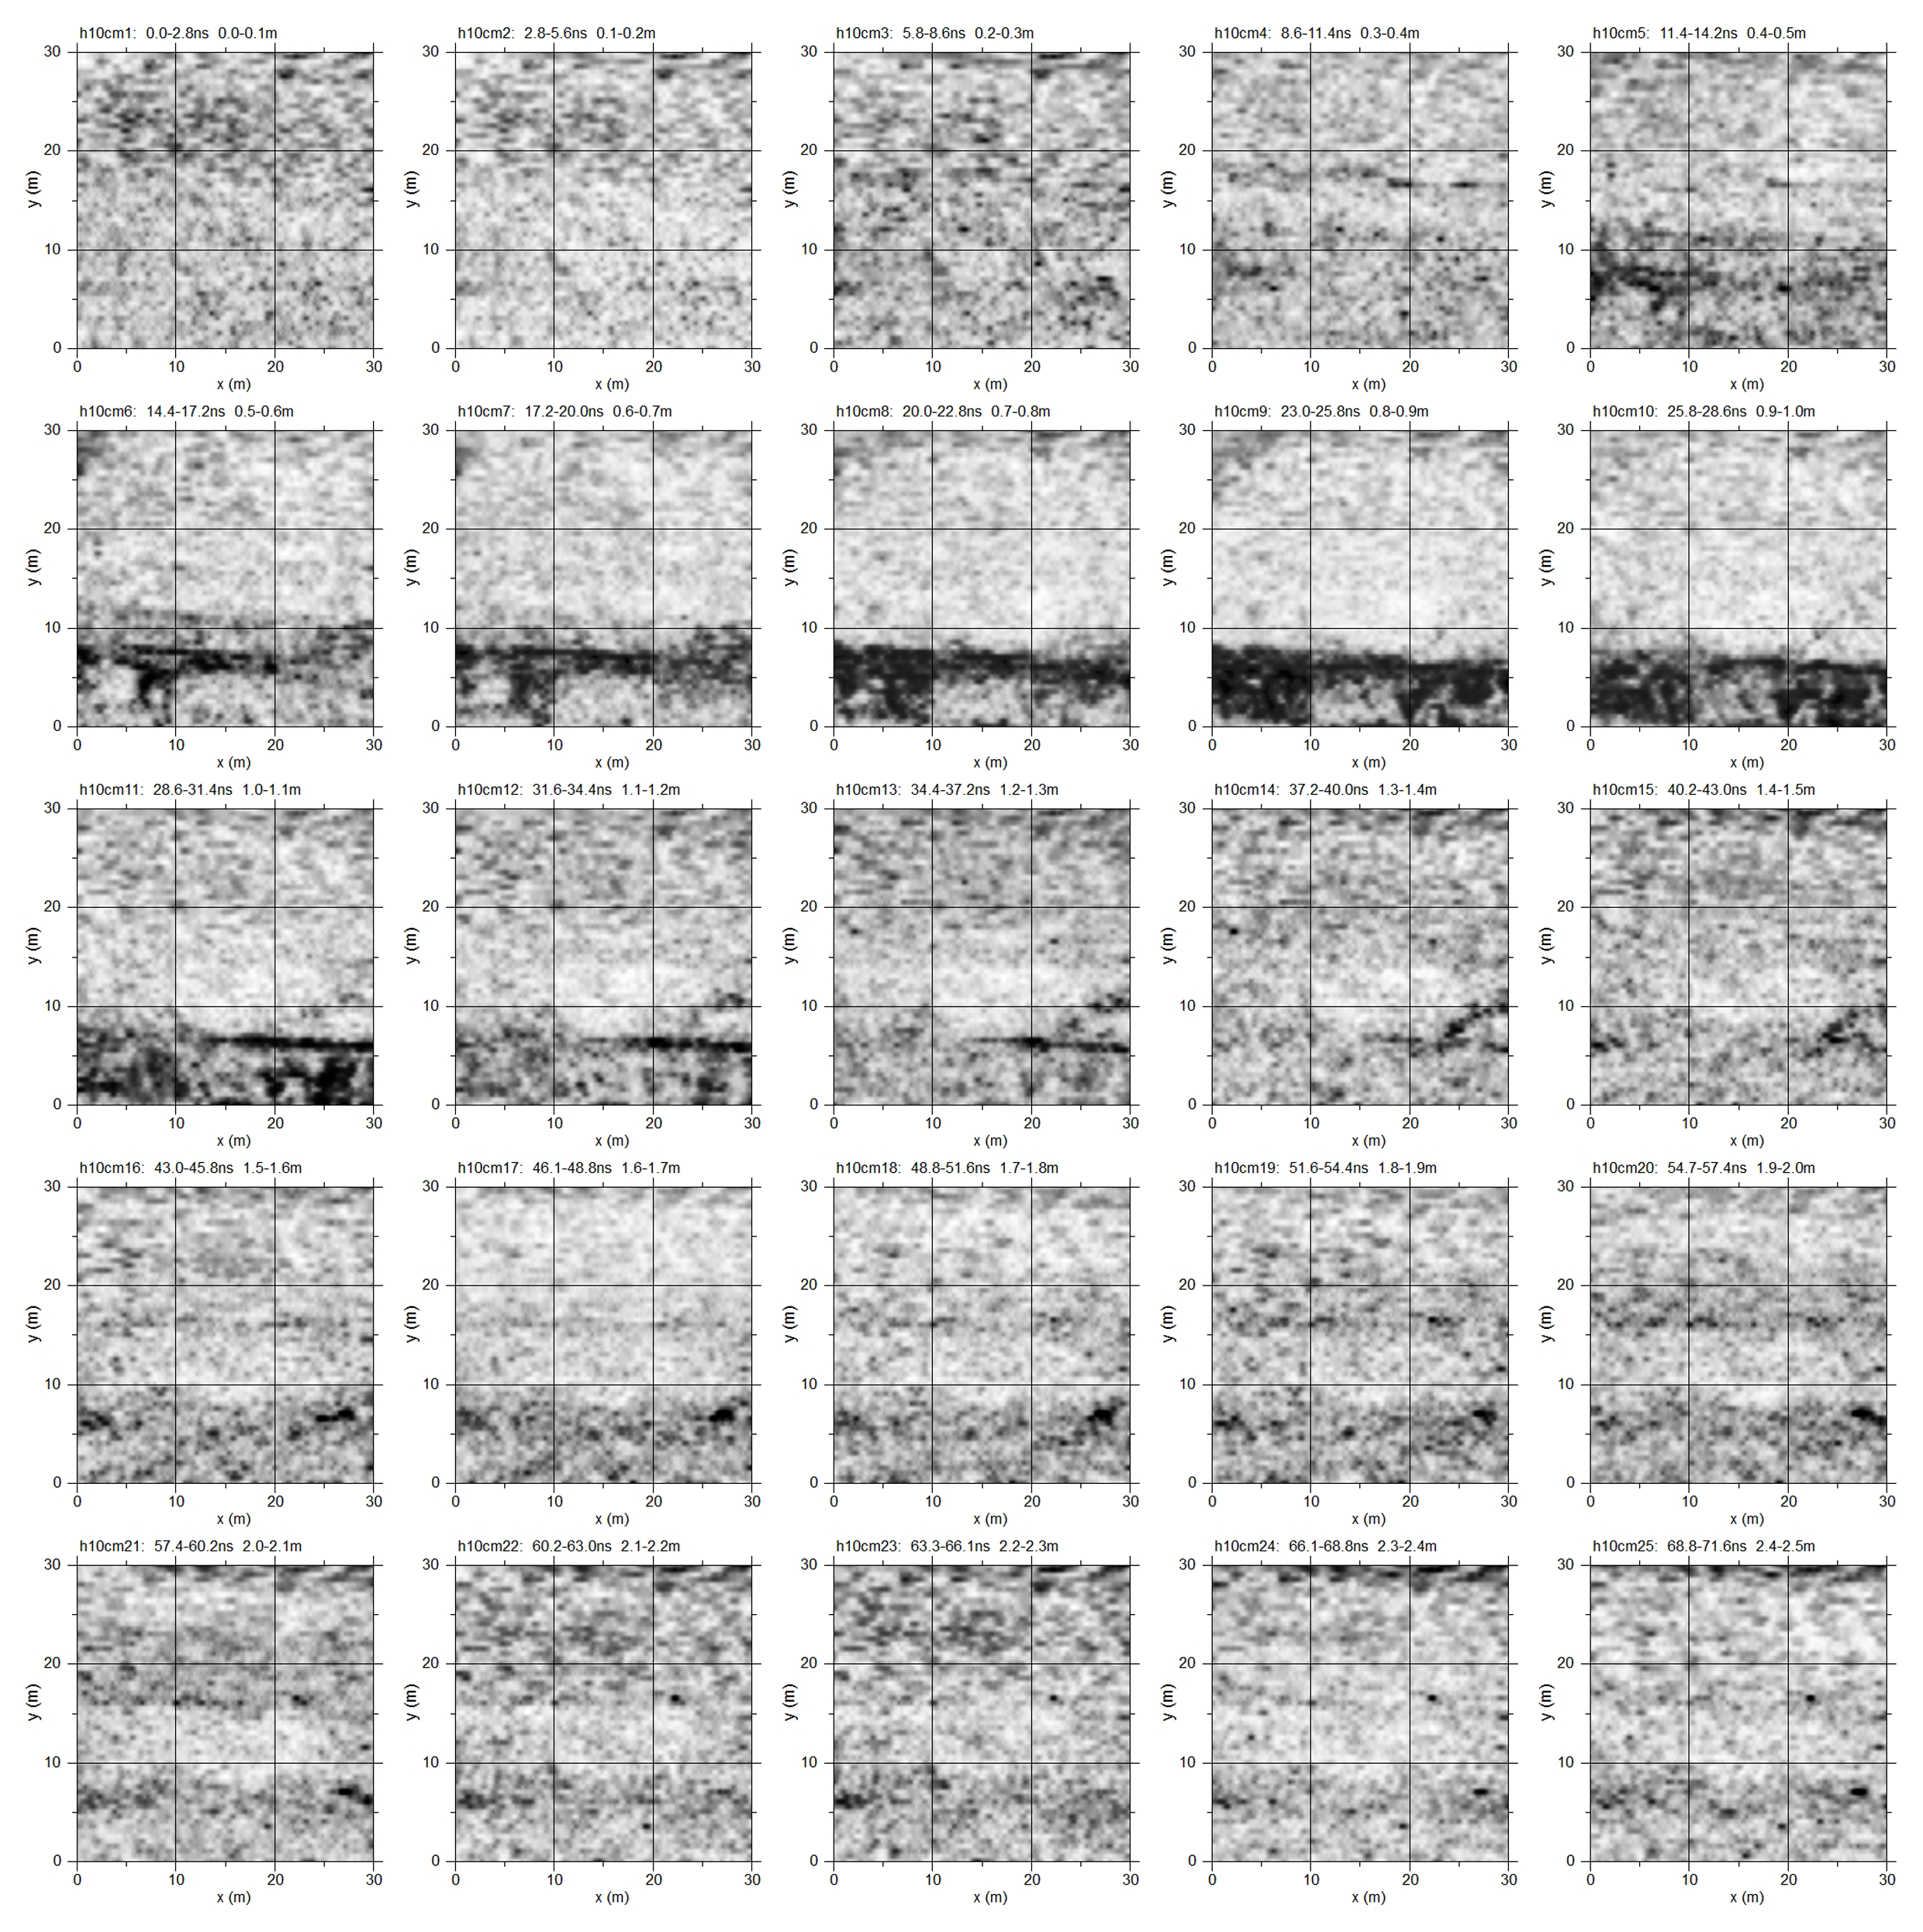
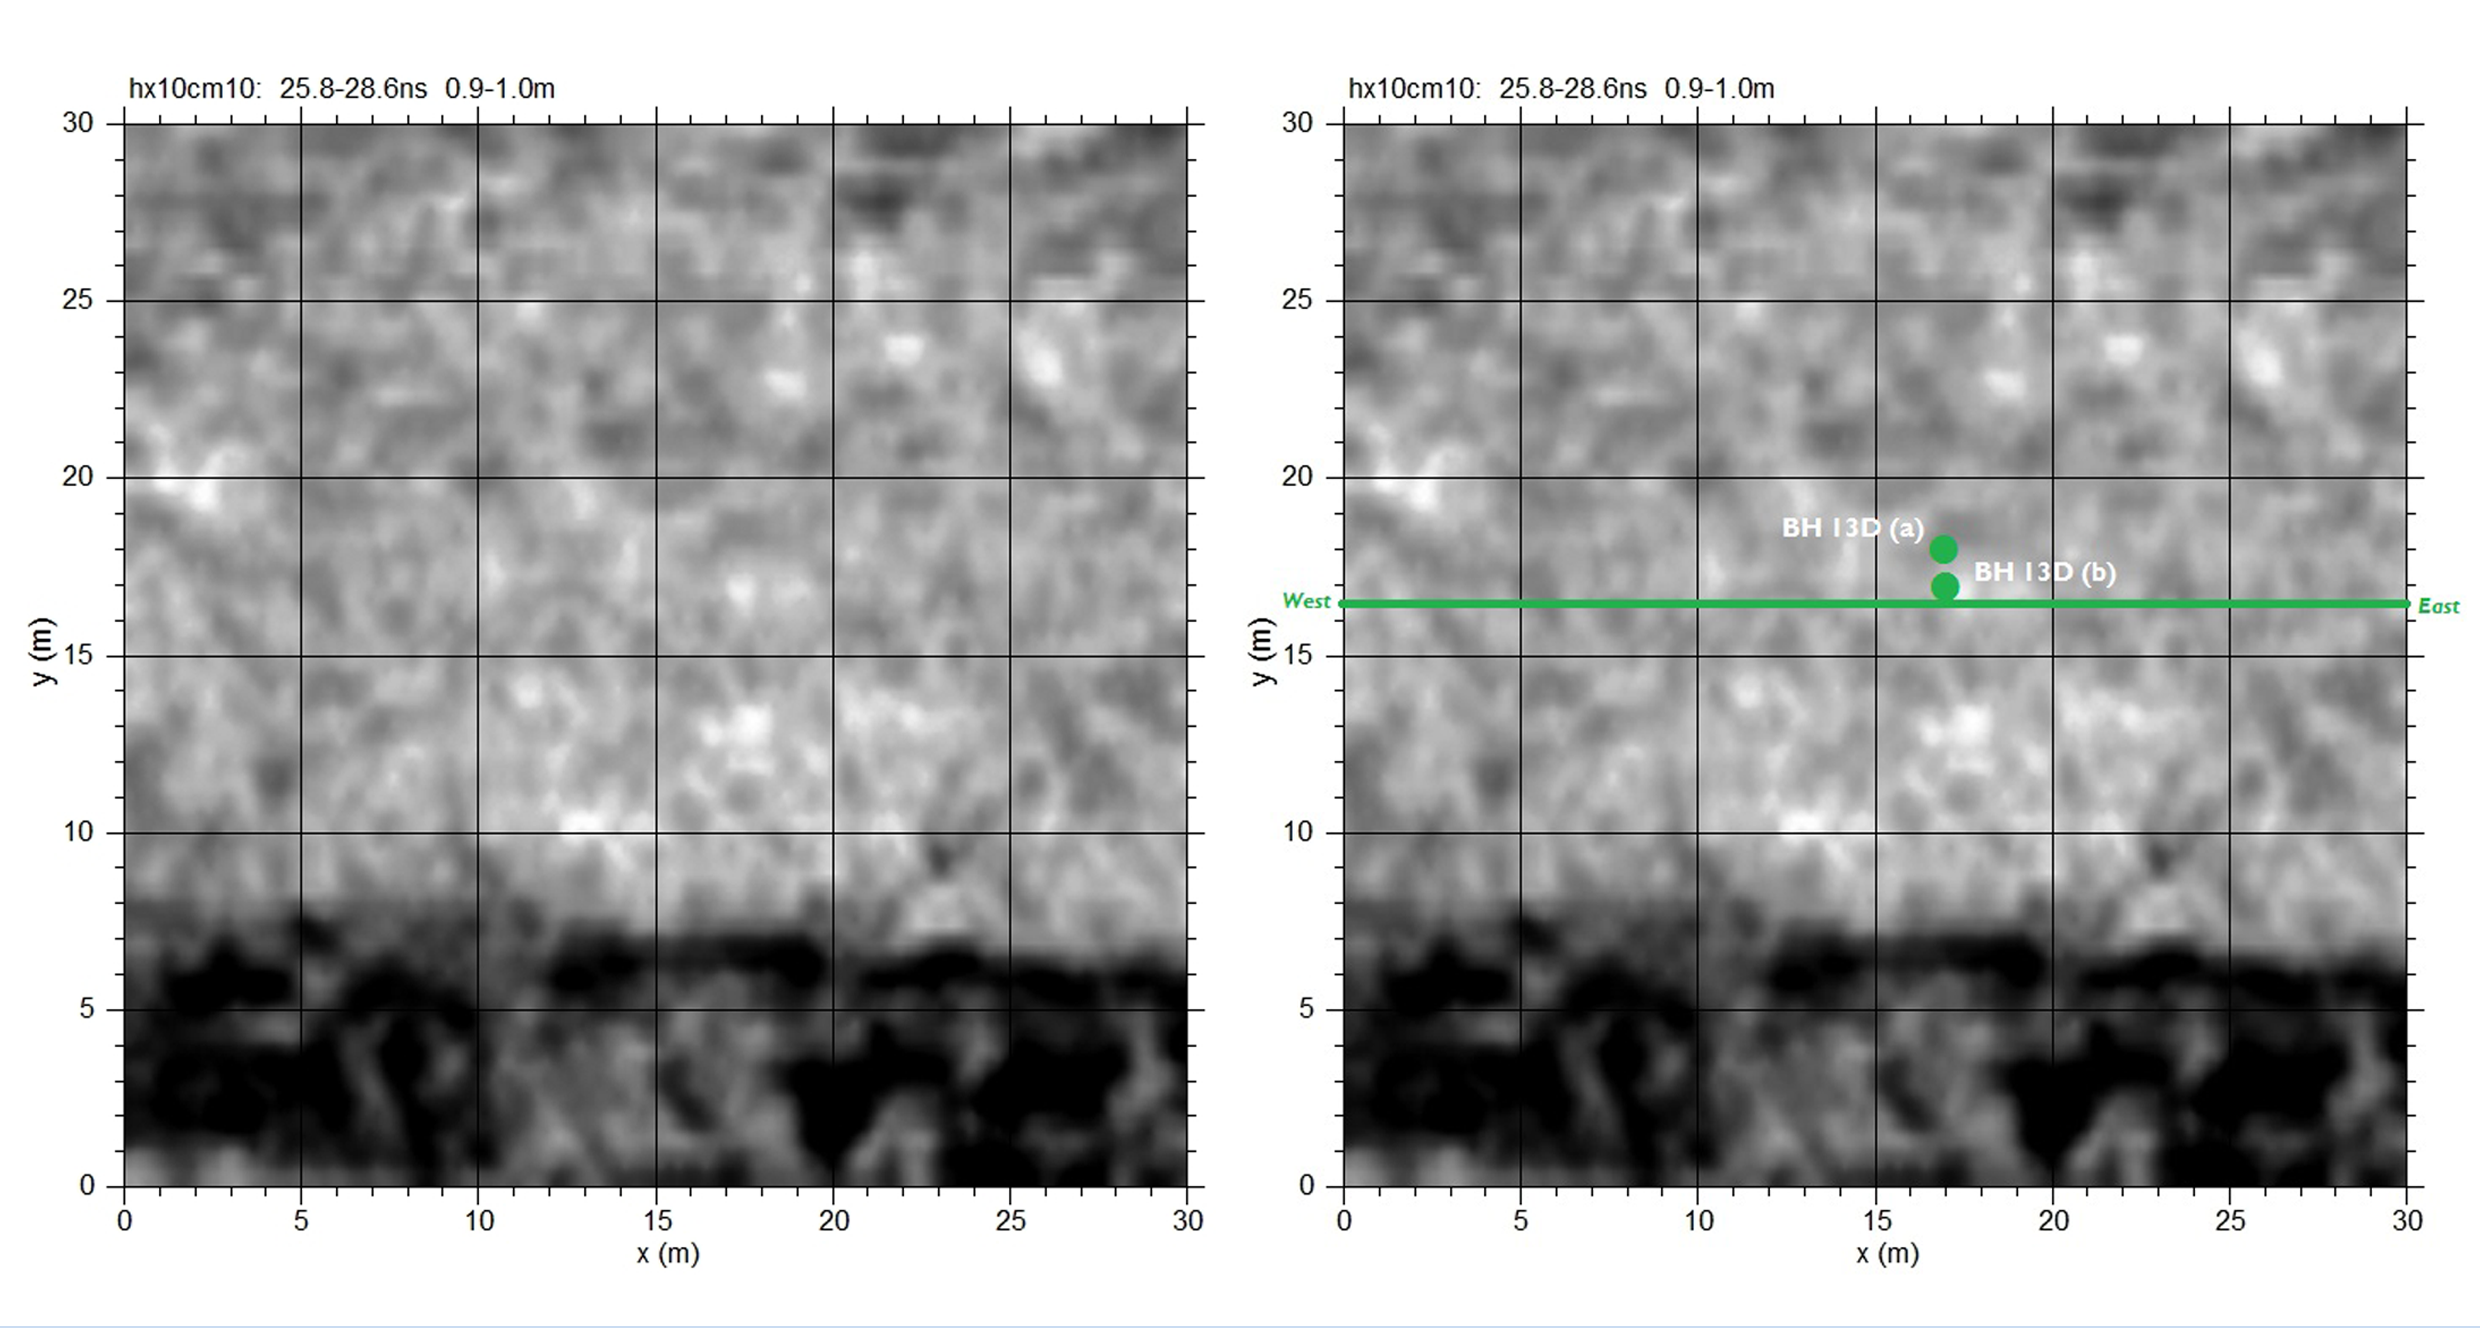
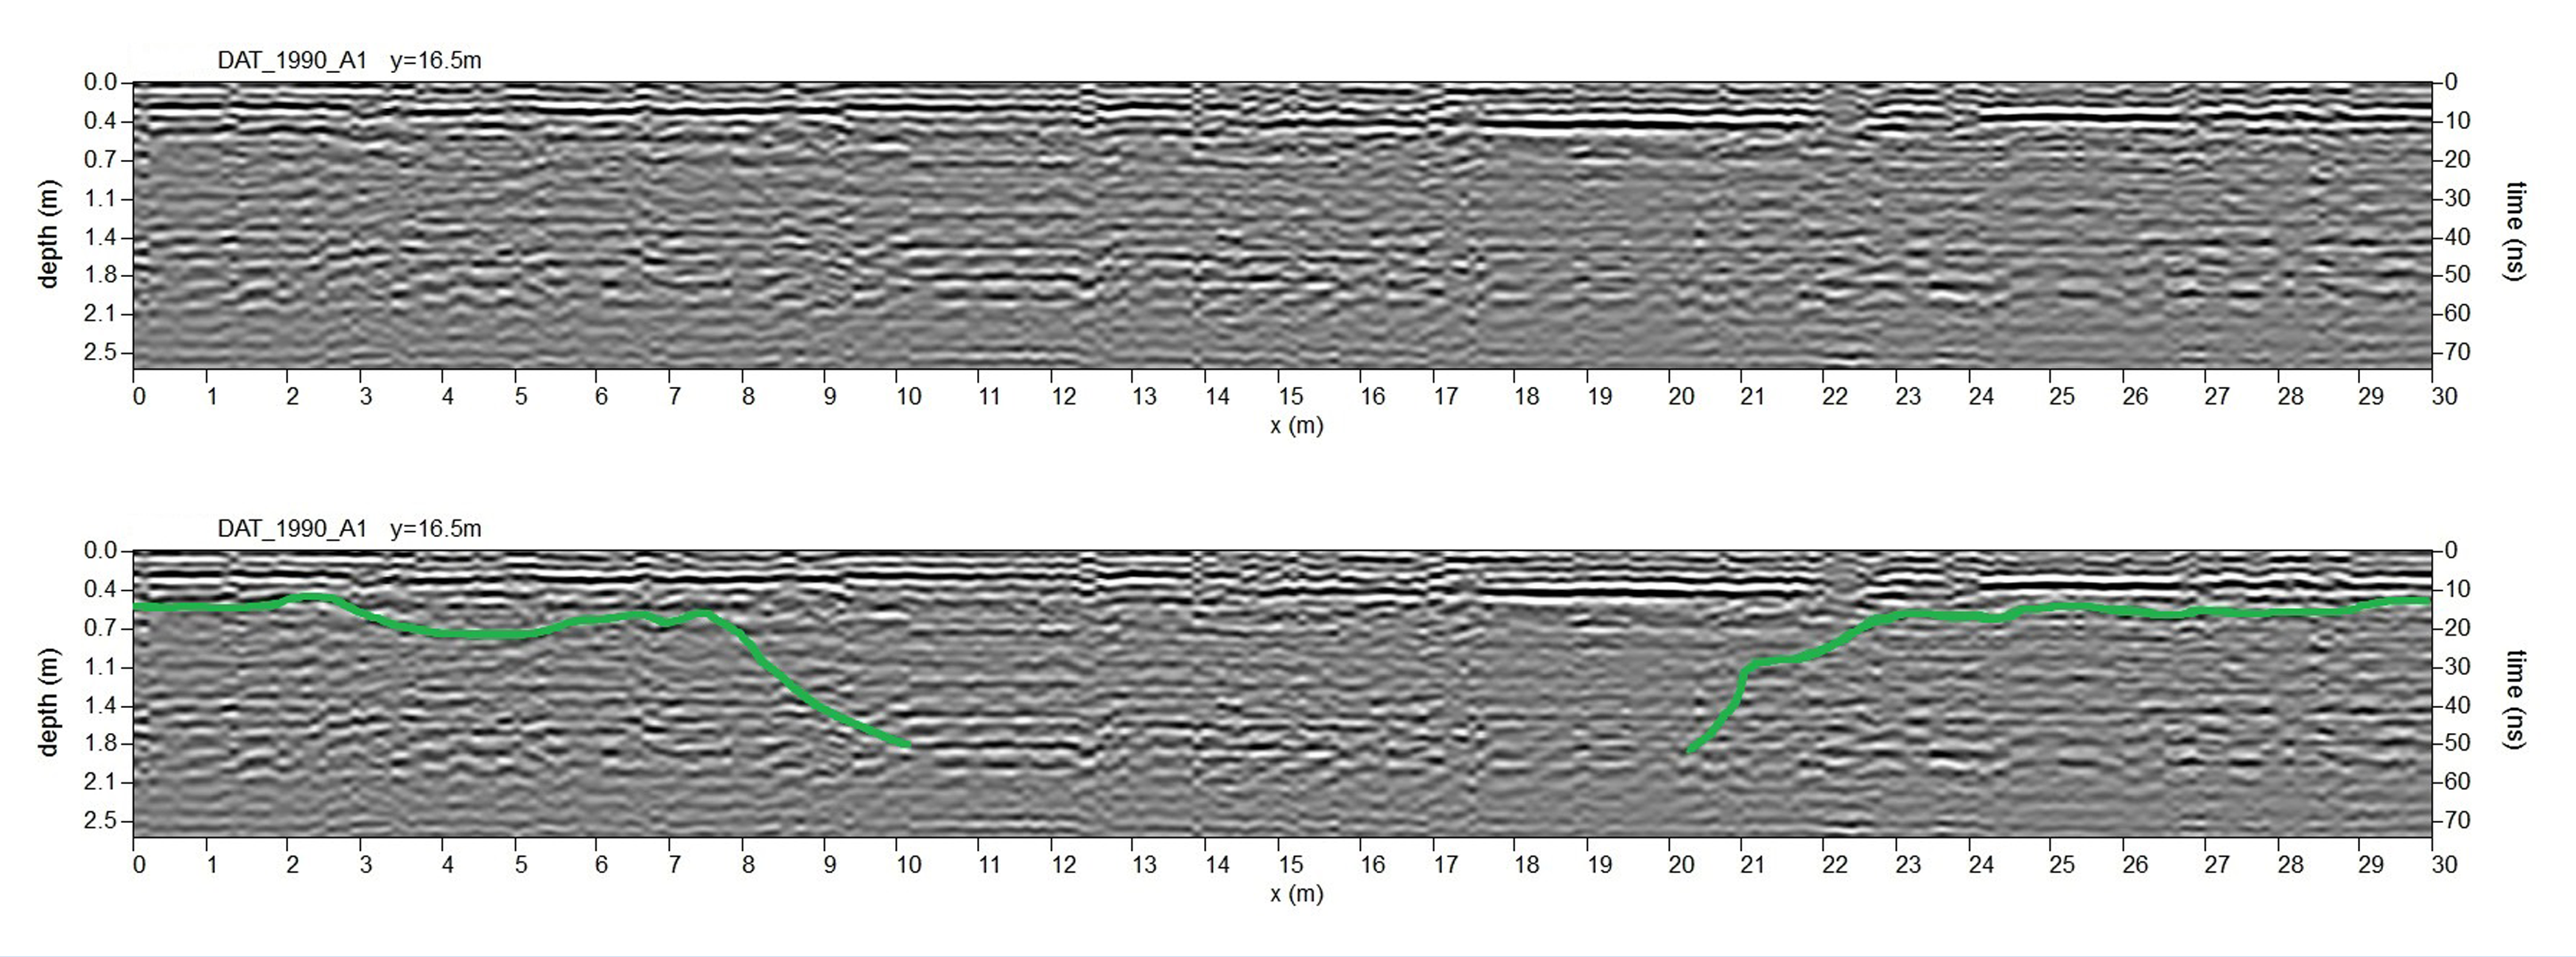
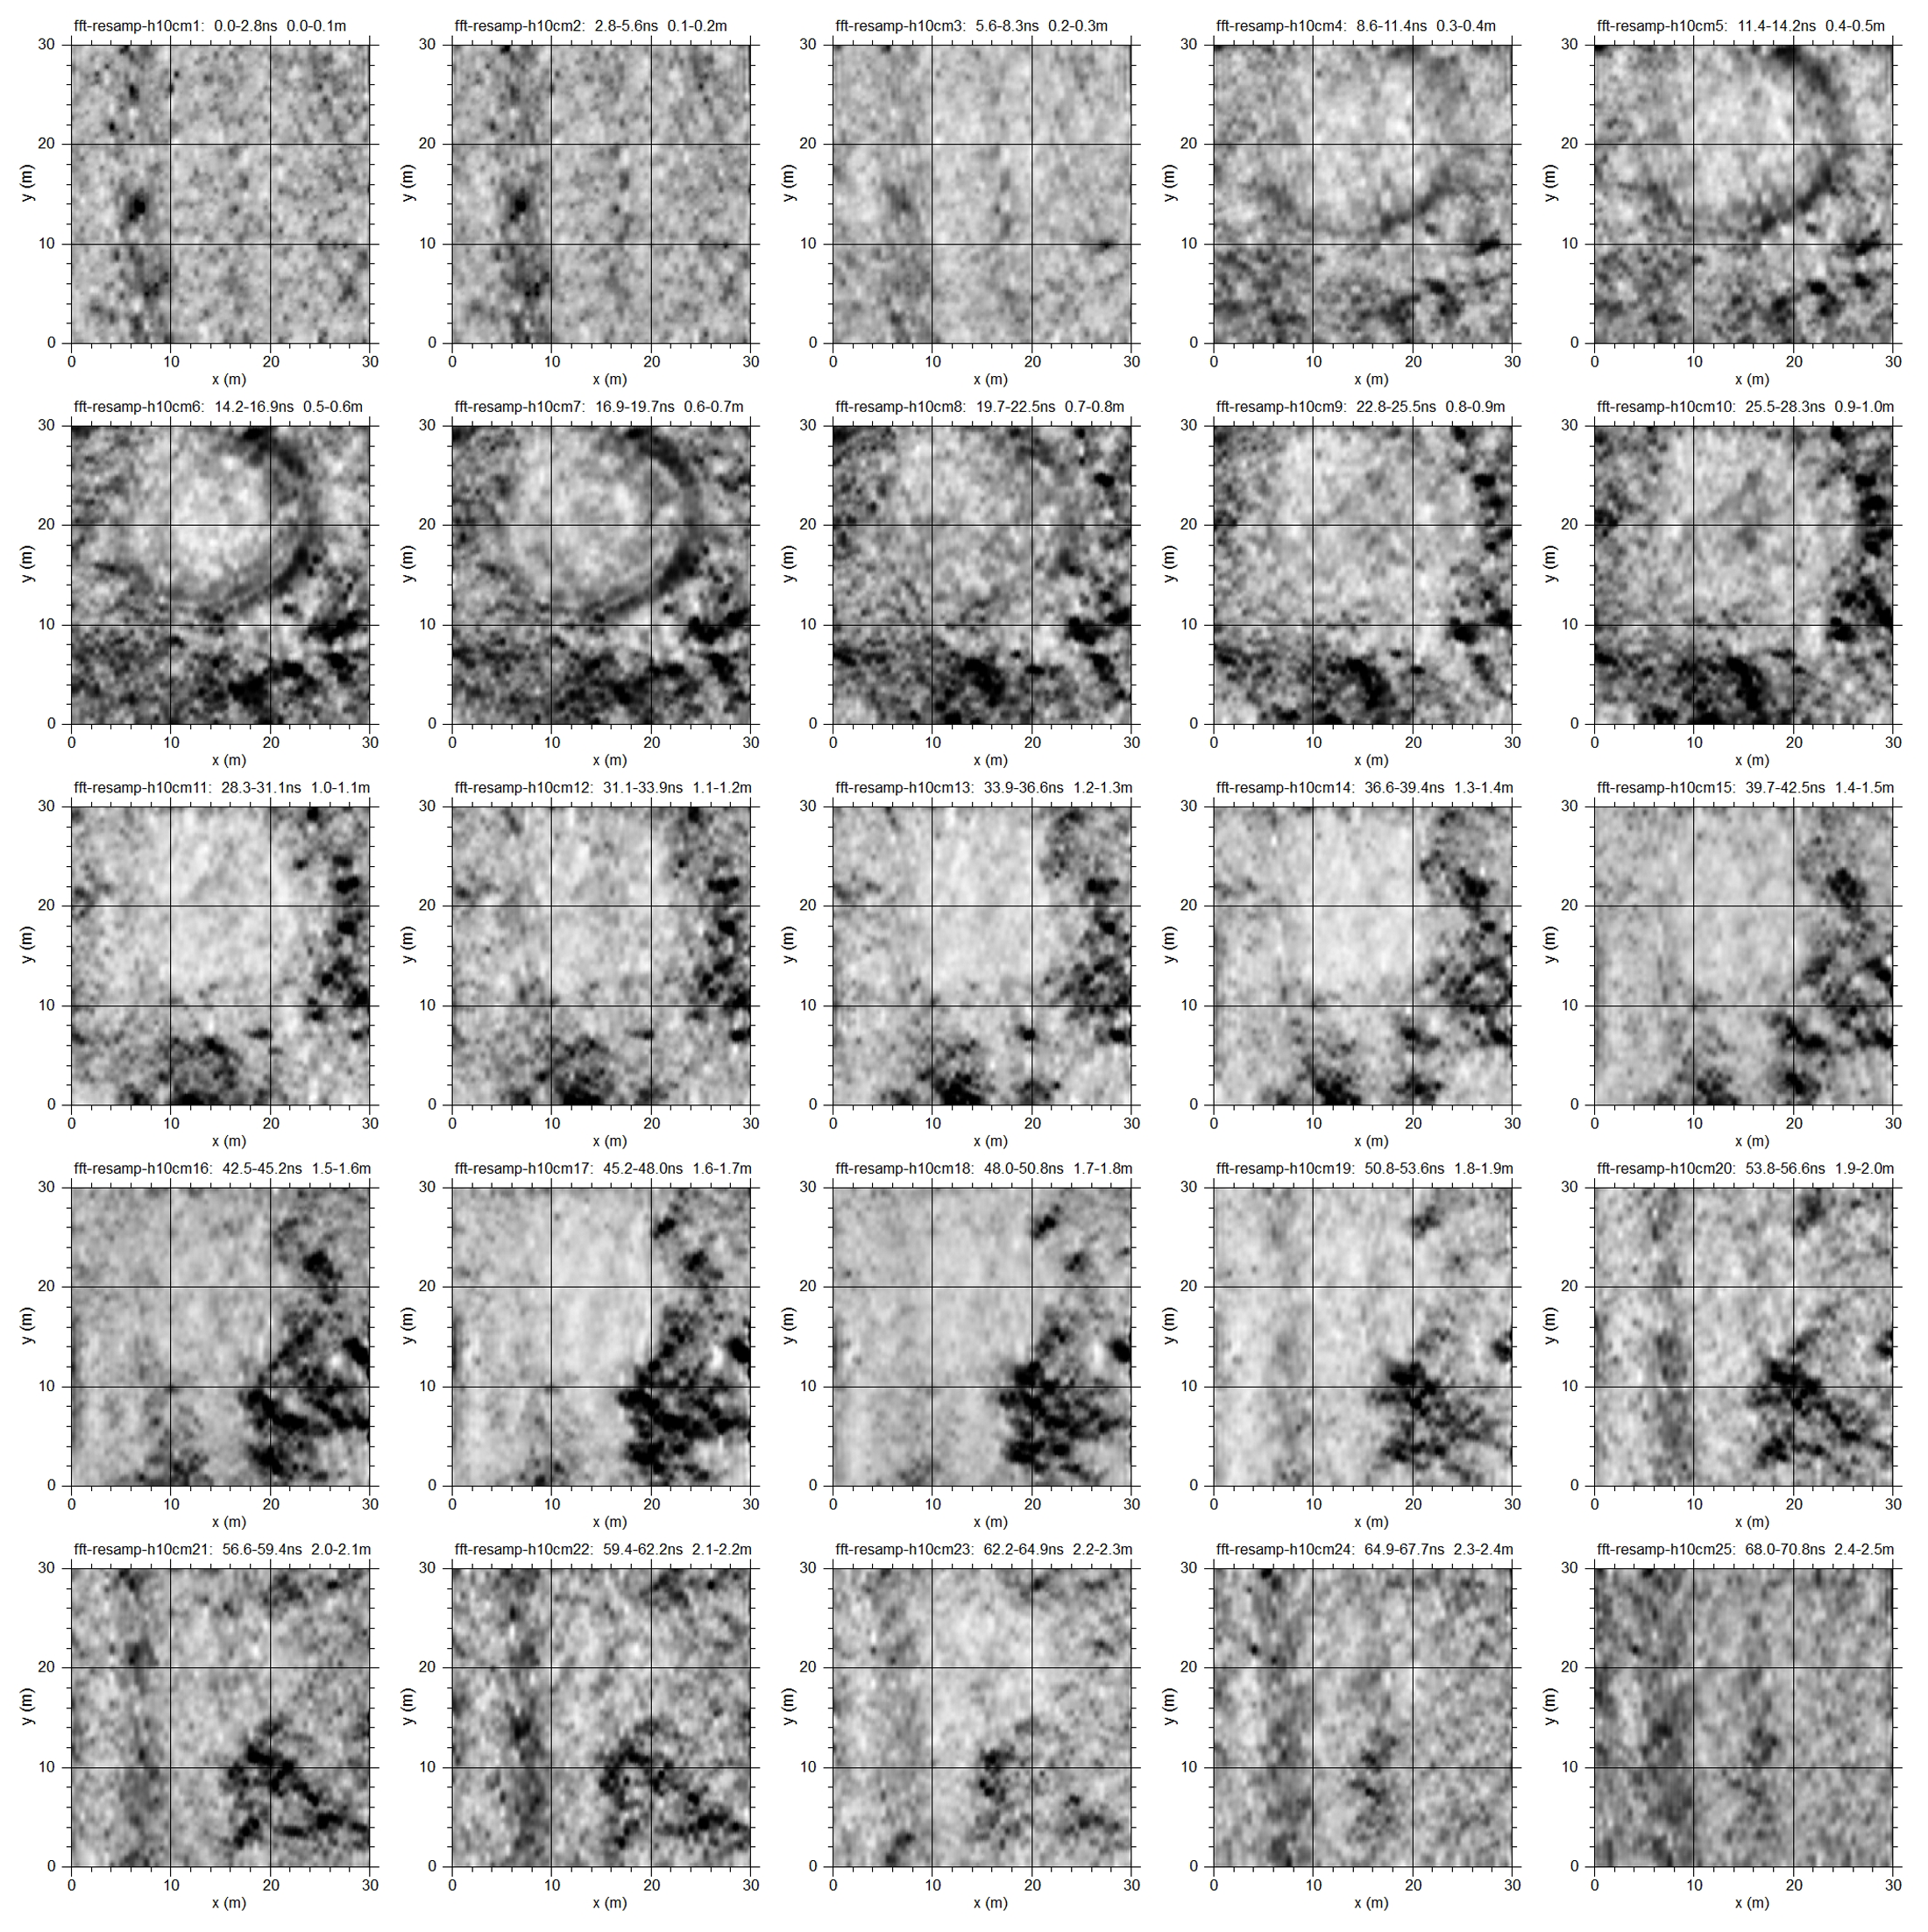
A 250MHz GPR survey was conducted in an east–west orientation across the shallow valley and over 13D with a traverse spacing of 0.5m. Figure 2.1 illustrates the data as time slices at increasing depth through the topsoil. The data reveal very little of the subsurface at 13D. At the time of the survey the weather conditions were very poor, owing to heavy and continuous rain. As a result, penetration was reduced, and the imagery may simply reflect variation in surface covering and not any subsurface feature. There is a suggestion, albeit very faint, of a circular feature about 25m in diameter in the uppermost time slices. There is a hint that this cut feature (possible weathering cone) was traceable in profile (radargram 1990 – Figs 2.2 and 2.3. However, these data are extremely noisy, possibly resulting from a combination of the rough nature of the ground surface (ploughed) and external electronic interference.
Time slices at a c.0.5m–1.2m depth are dominated by strong amplitude responses associated with a backfilled excavation trench (Leivers et al. 2020) that runs diagonally WWE–ESSE across the survey area immediately in front of 13D.
This feature was identified by the Stonehenge Hidden Landscape project from aerial photography (Gaffney et al. (2020, Anomaly v) and surveyed in 2021 to confirm its interpretation as most probably belonging to the northern arc of pits. Following confirmation of its magnetic characteristics, Anomaly v was renamed 16D).
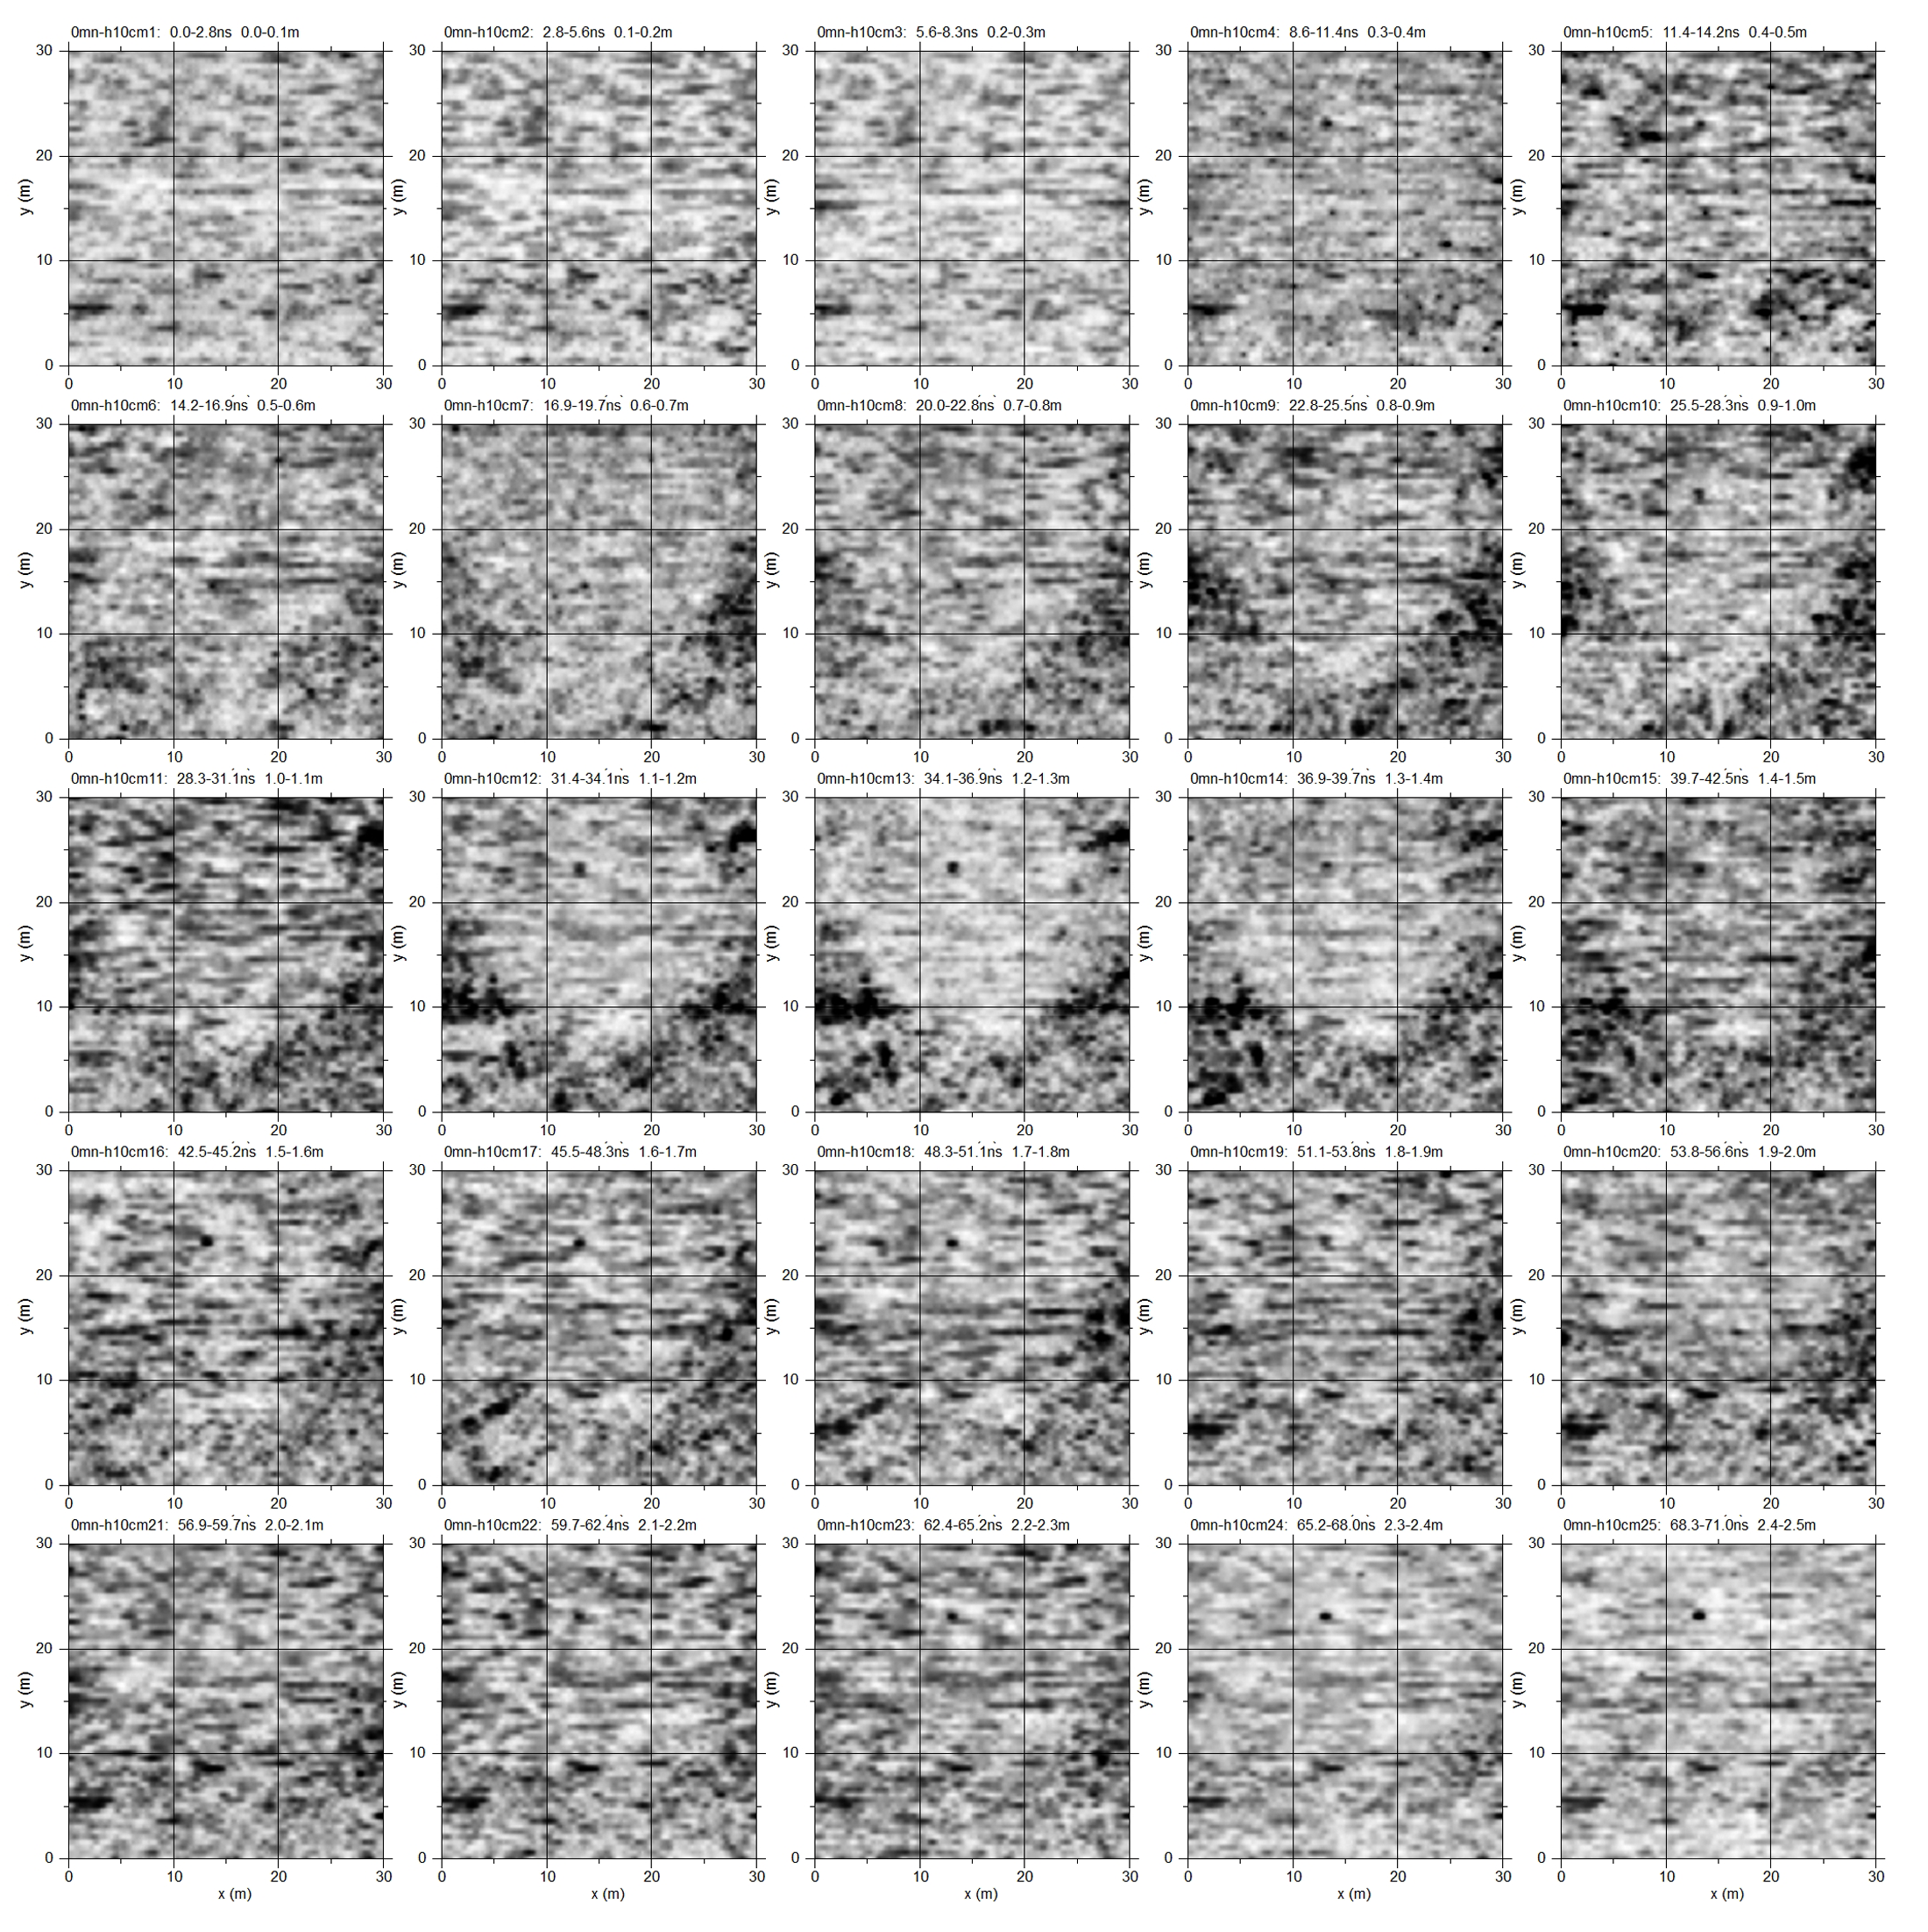
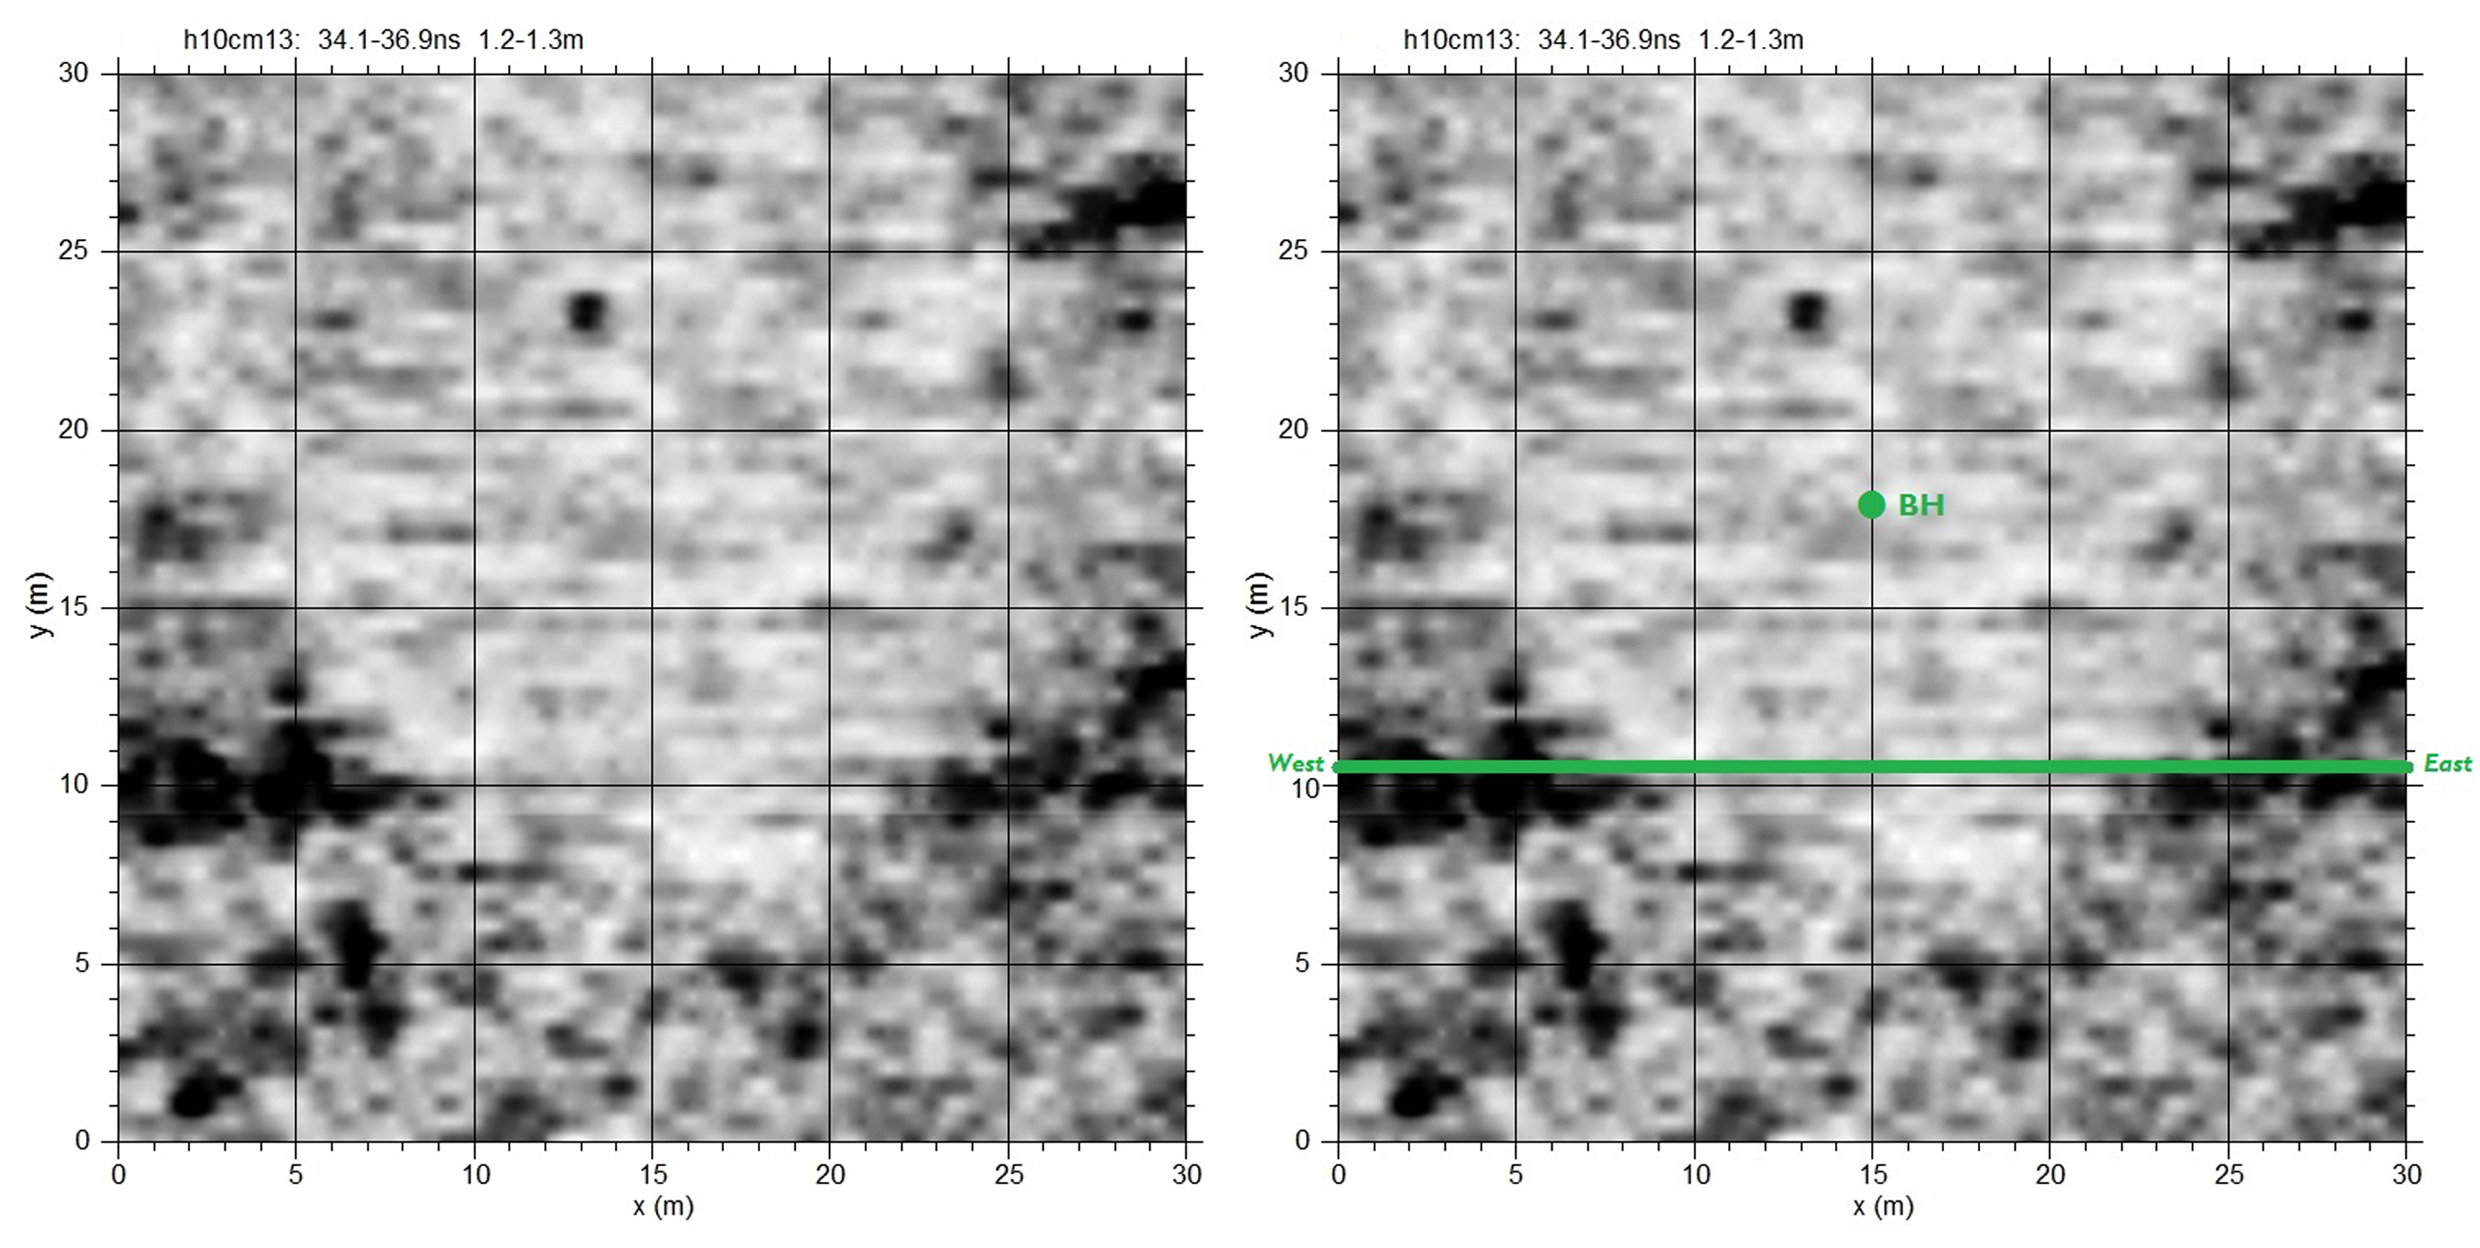
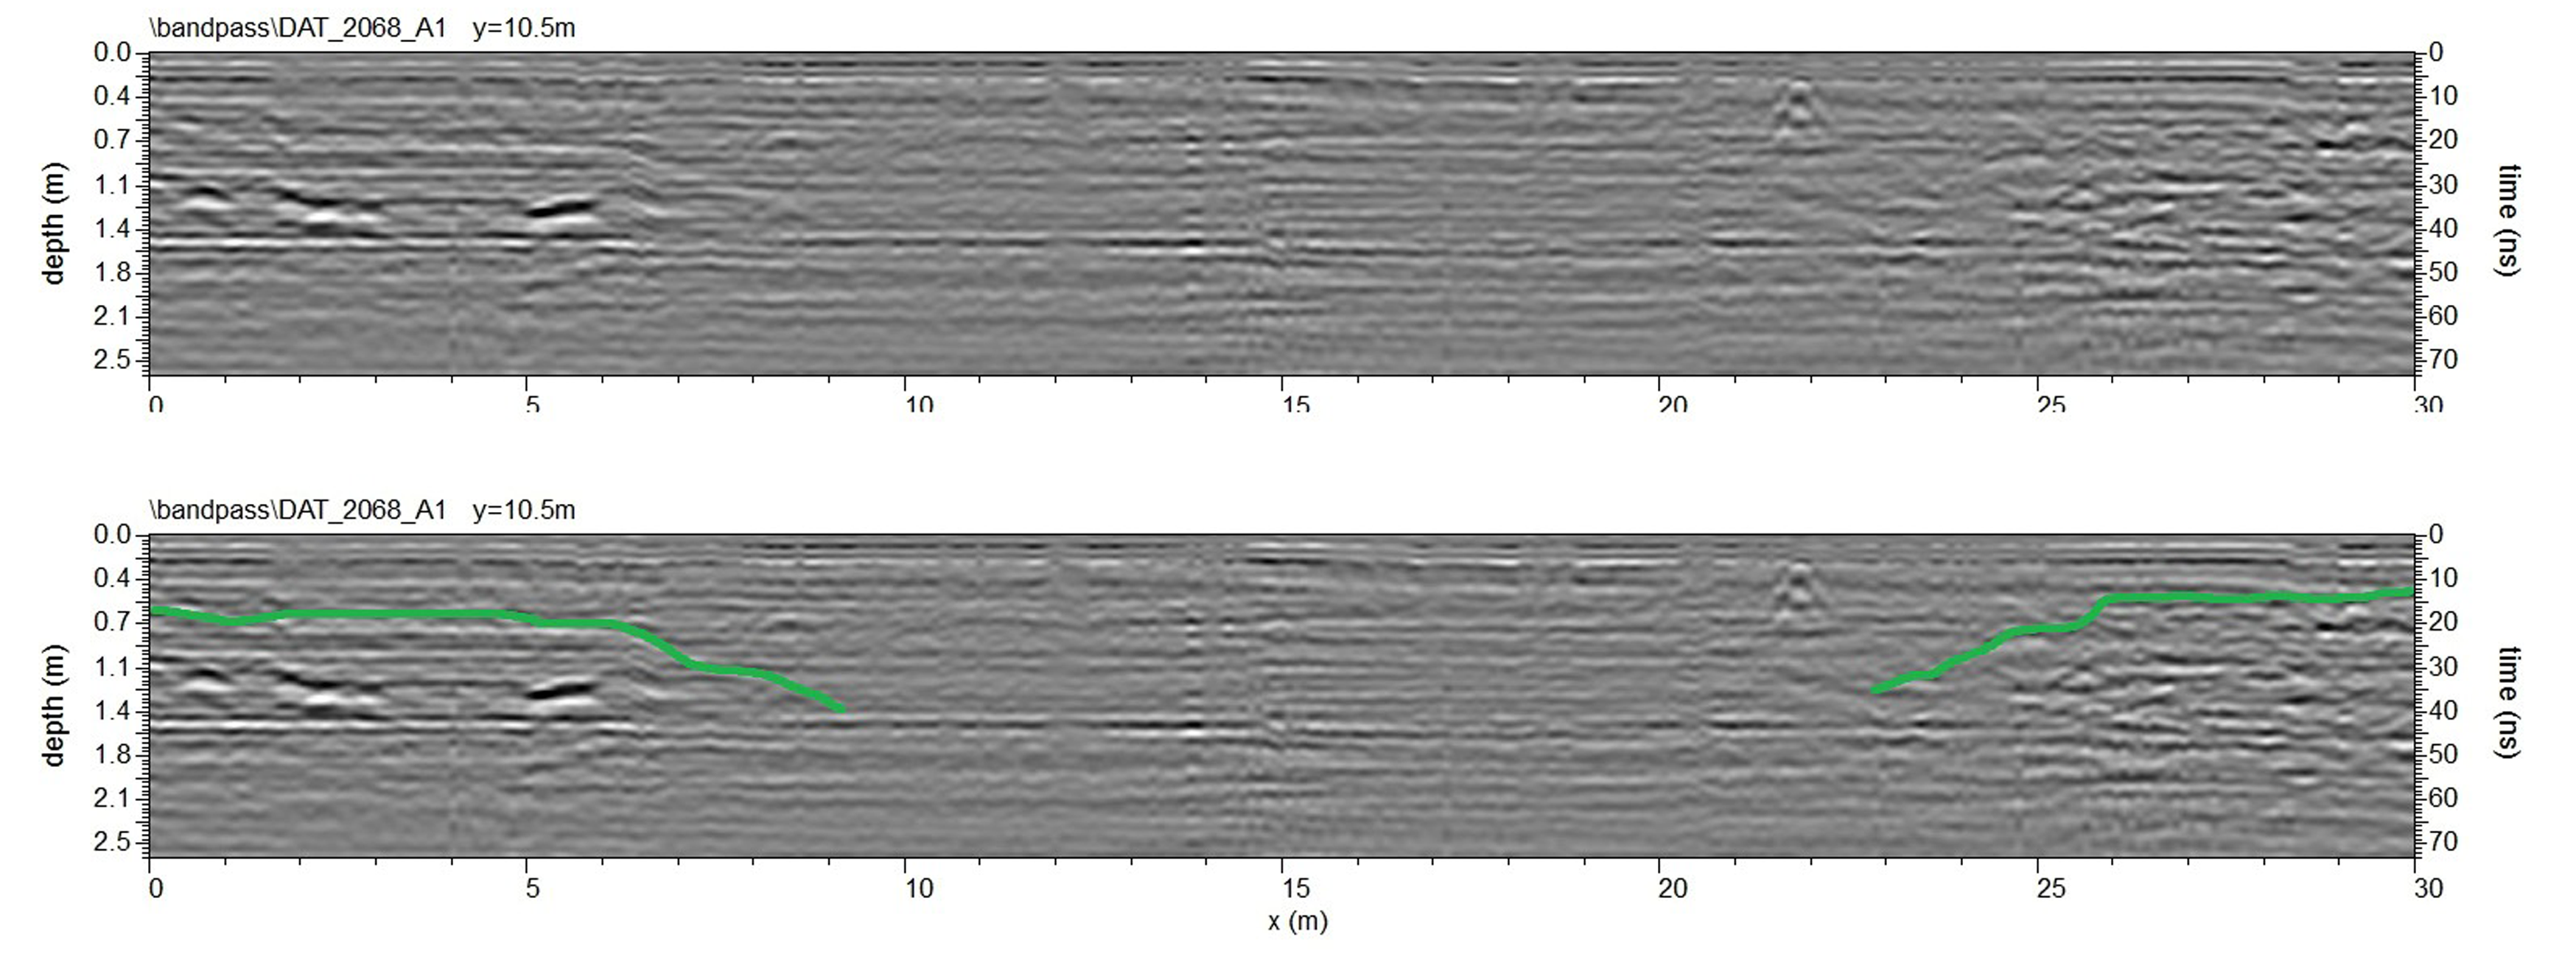
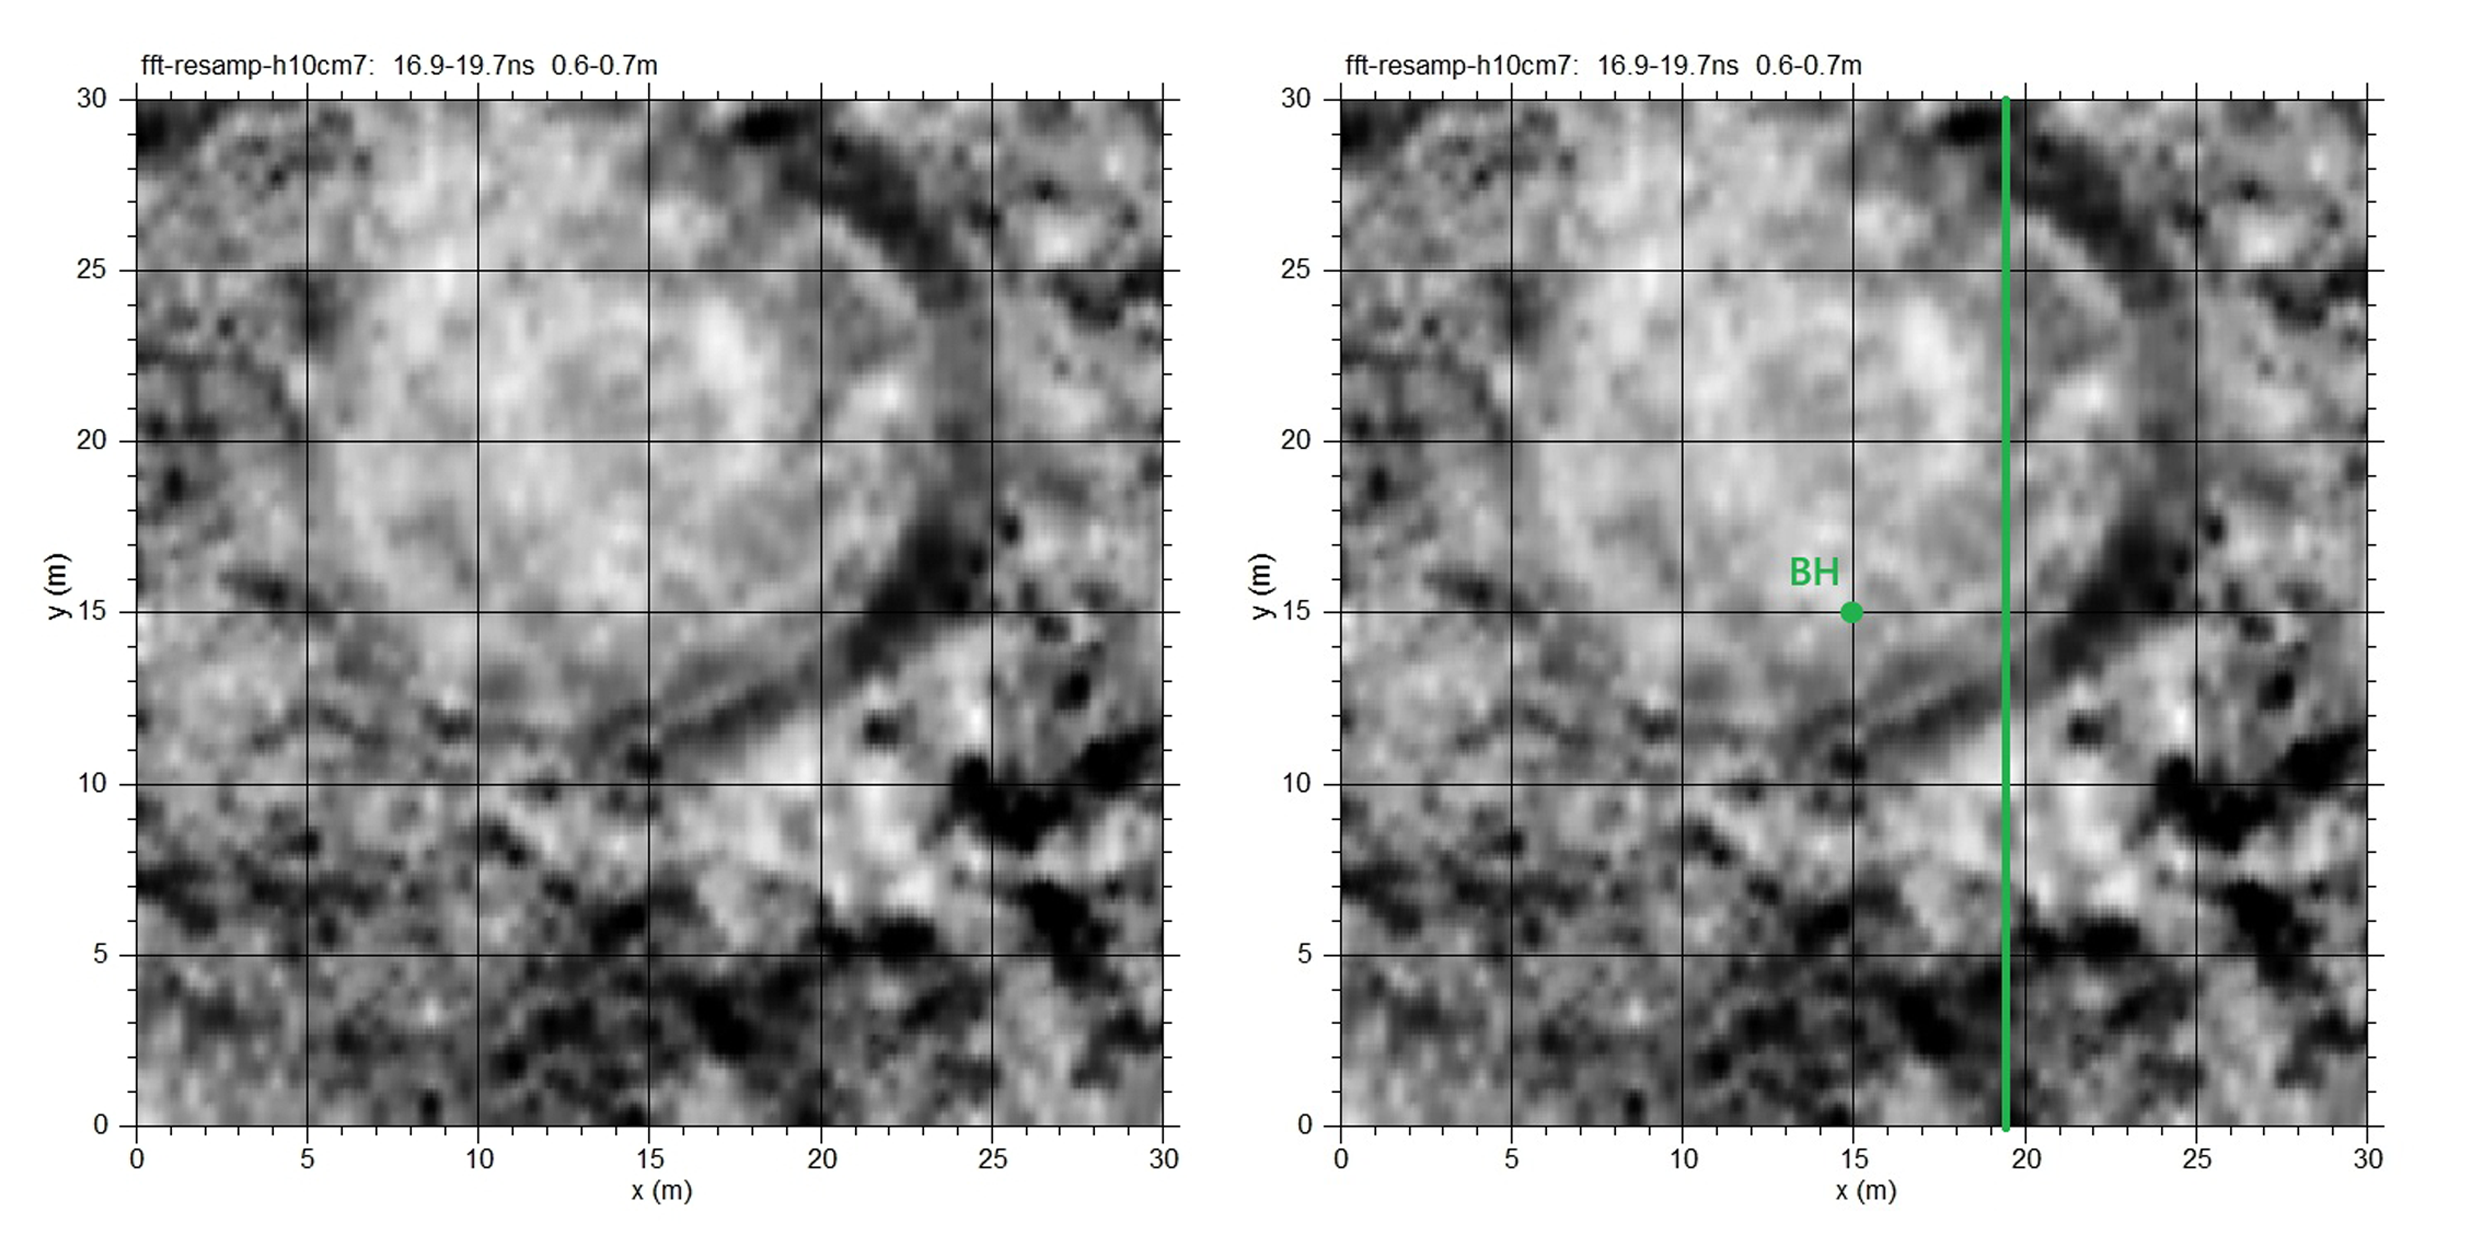
A 250MHz GPR survey was conducted in an east–west orientation across the shallow valley and over 16D with a traverse spacing of 0.5m. Figure 2.4 shows the data in time slice maps at increasing depth through the topsoil. The data reveal little of the subsurface at 16D, as weather conditions were very poor at the time of the survey, owing to heavy and continuous rain. Despite limited penetration, an ovate feature c.20–25m in dimension is discernible, contrasting with underlying geological responses at time slice depths of c.0.6 –1.5m. There is some suggestion that this cut feature (possible weathering cone) is traceable in profile (radargram 2068 – Figs 2.5 and 2.6).
This feature was previously identified by an LBI ArchPro magnetometer survey in 2013 as part of the Stonehenge Hidden Landscape project (see Gaffney et al. (2020, supplementary data 1).
A 250MHz GPR survey was conducted over an area of 30m x 30m, in which 1A was located. Ground conditions were dry enough for a clear GPR signal from the feature.
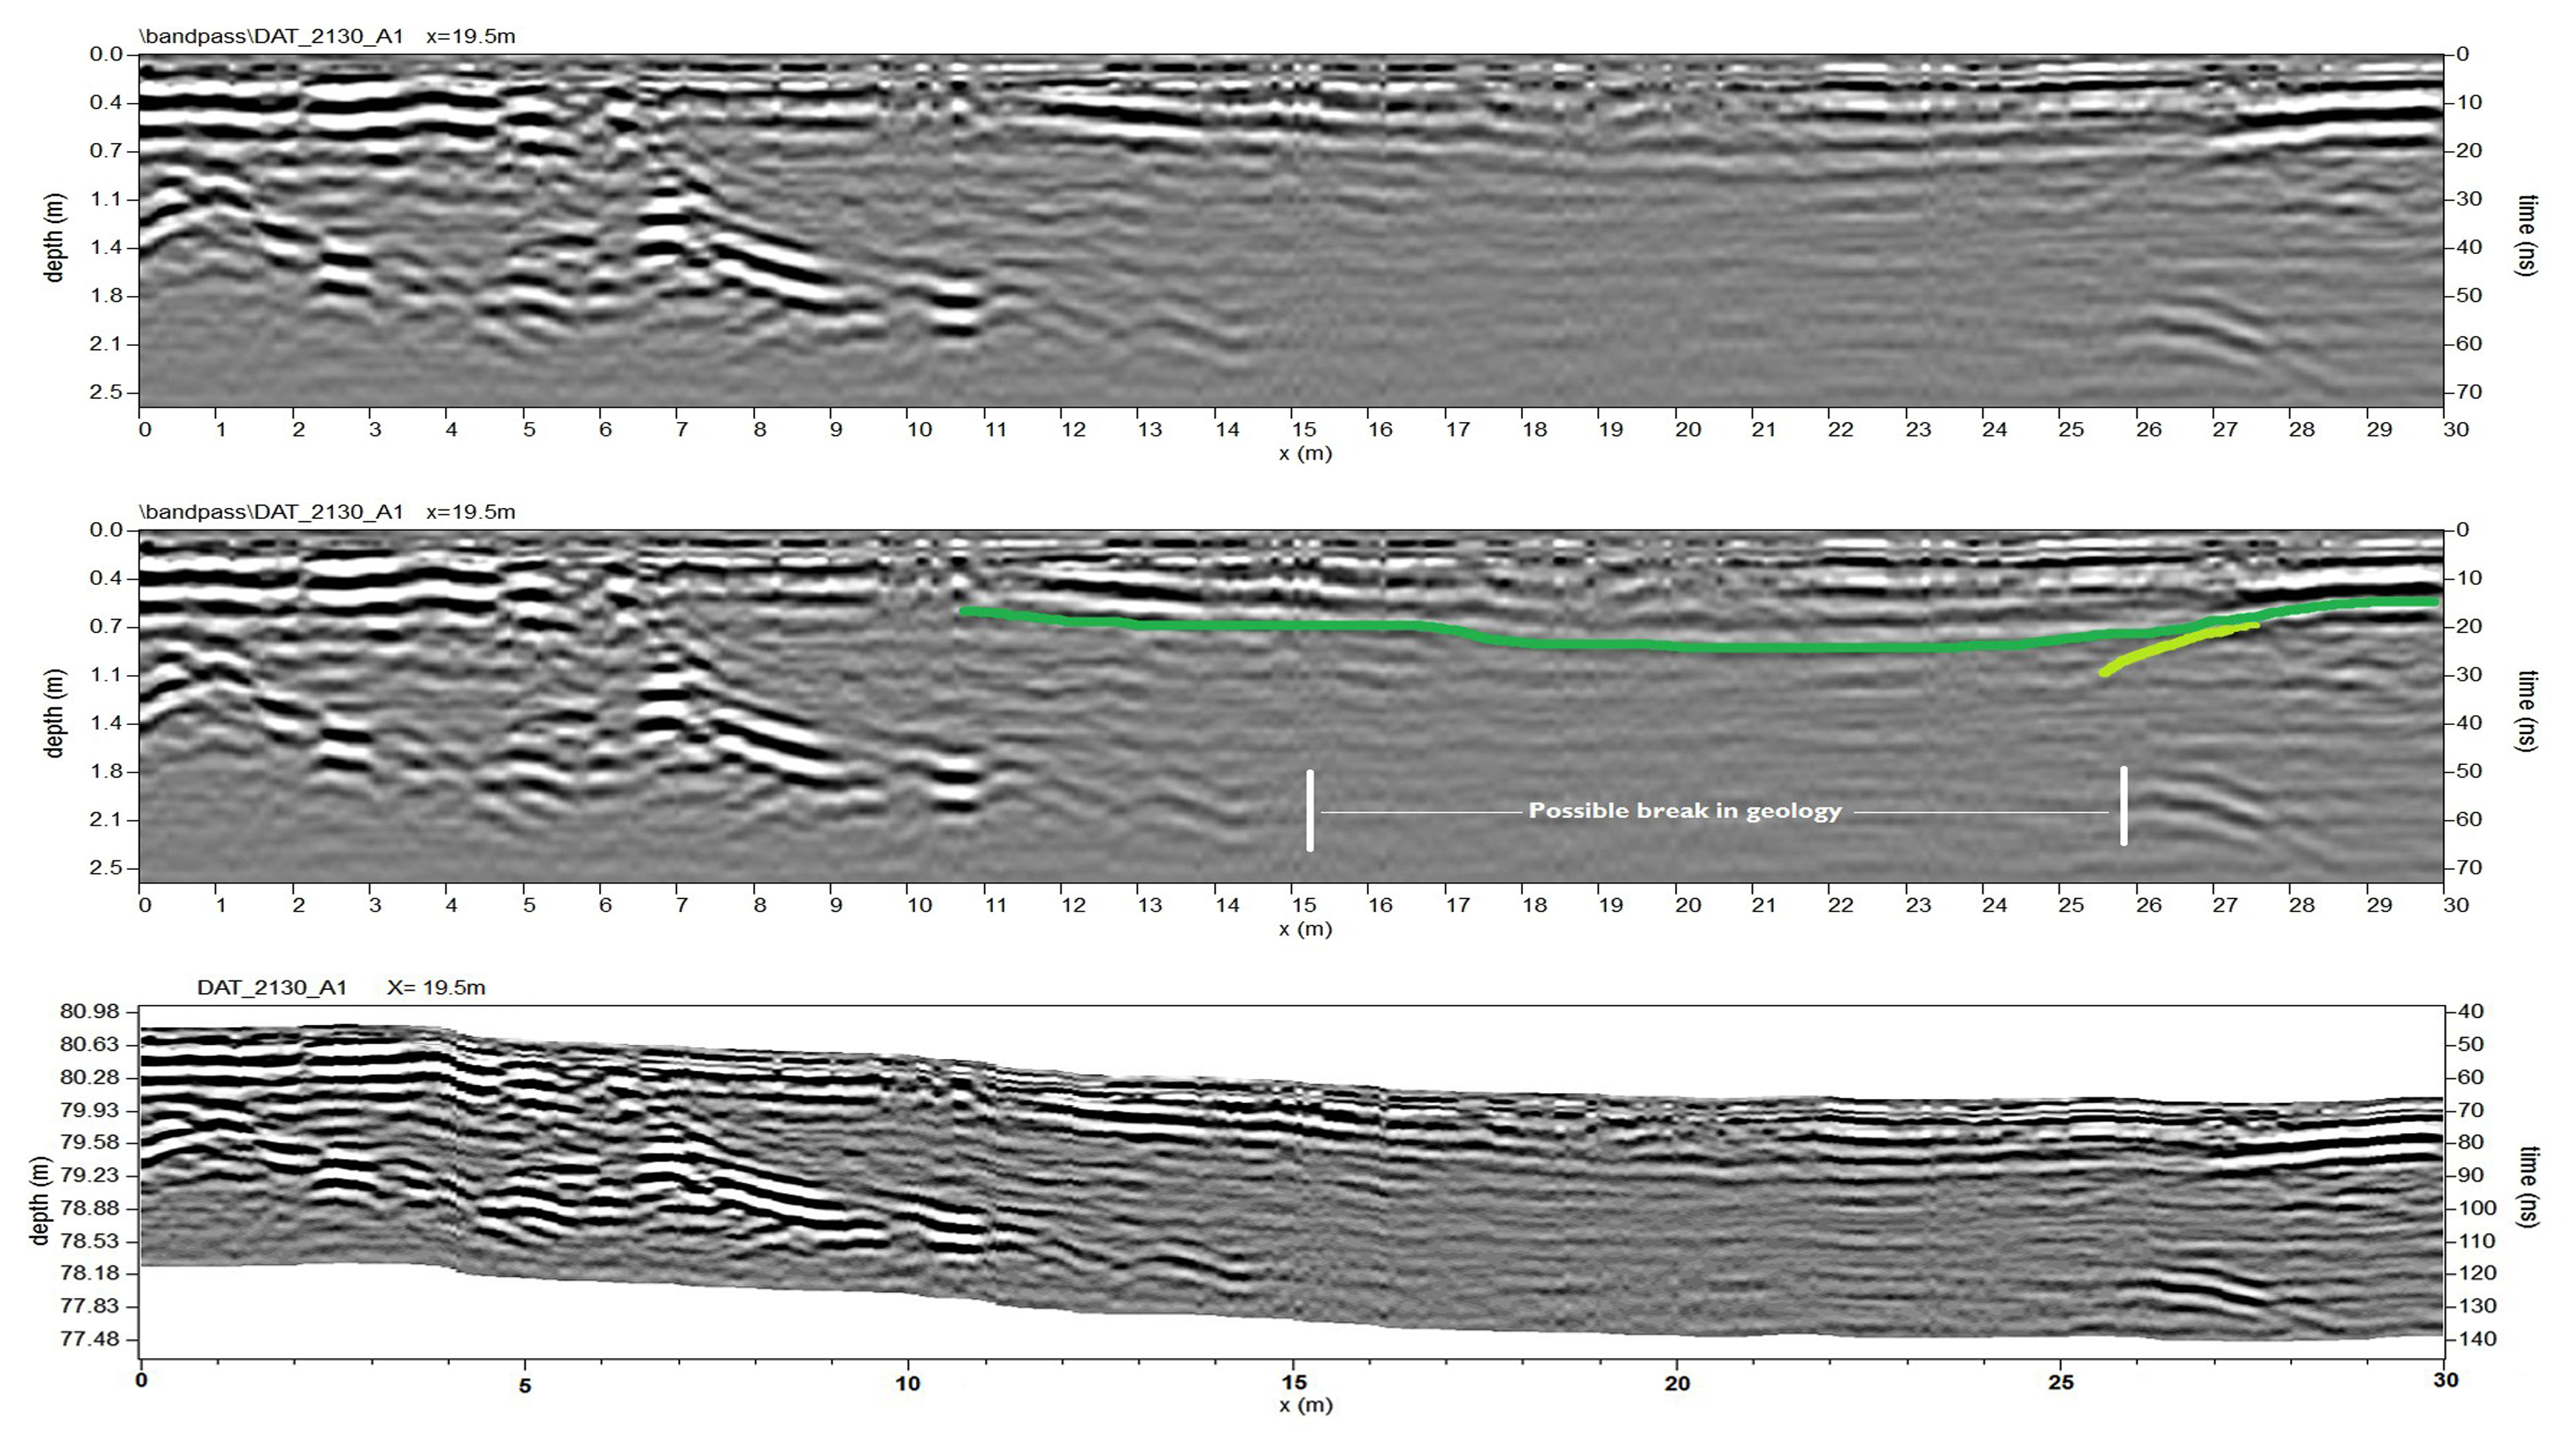
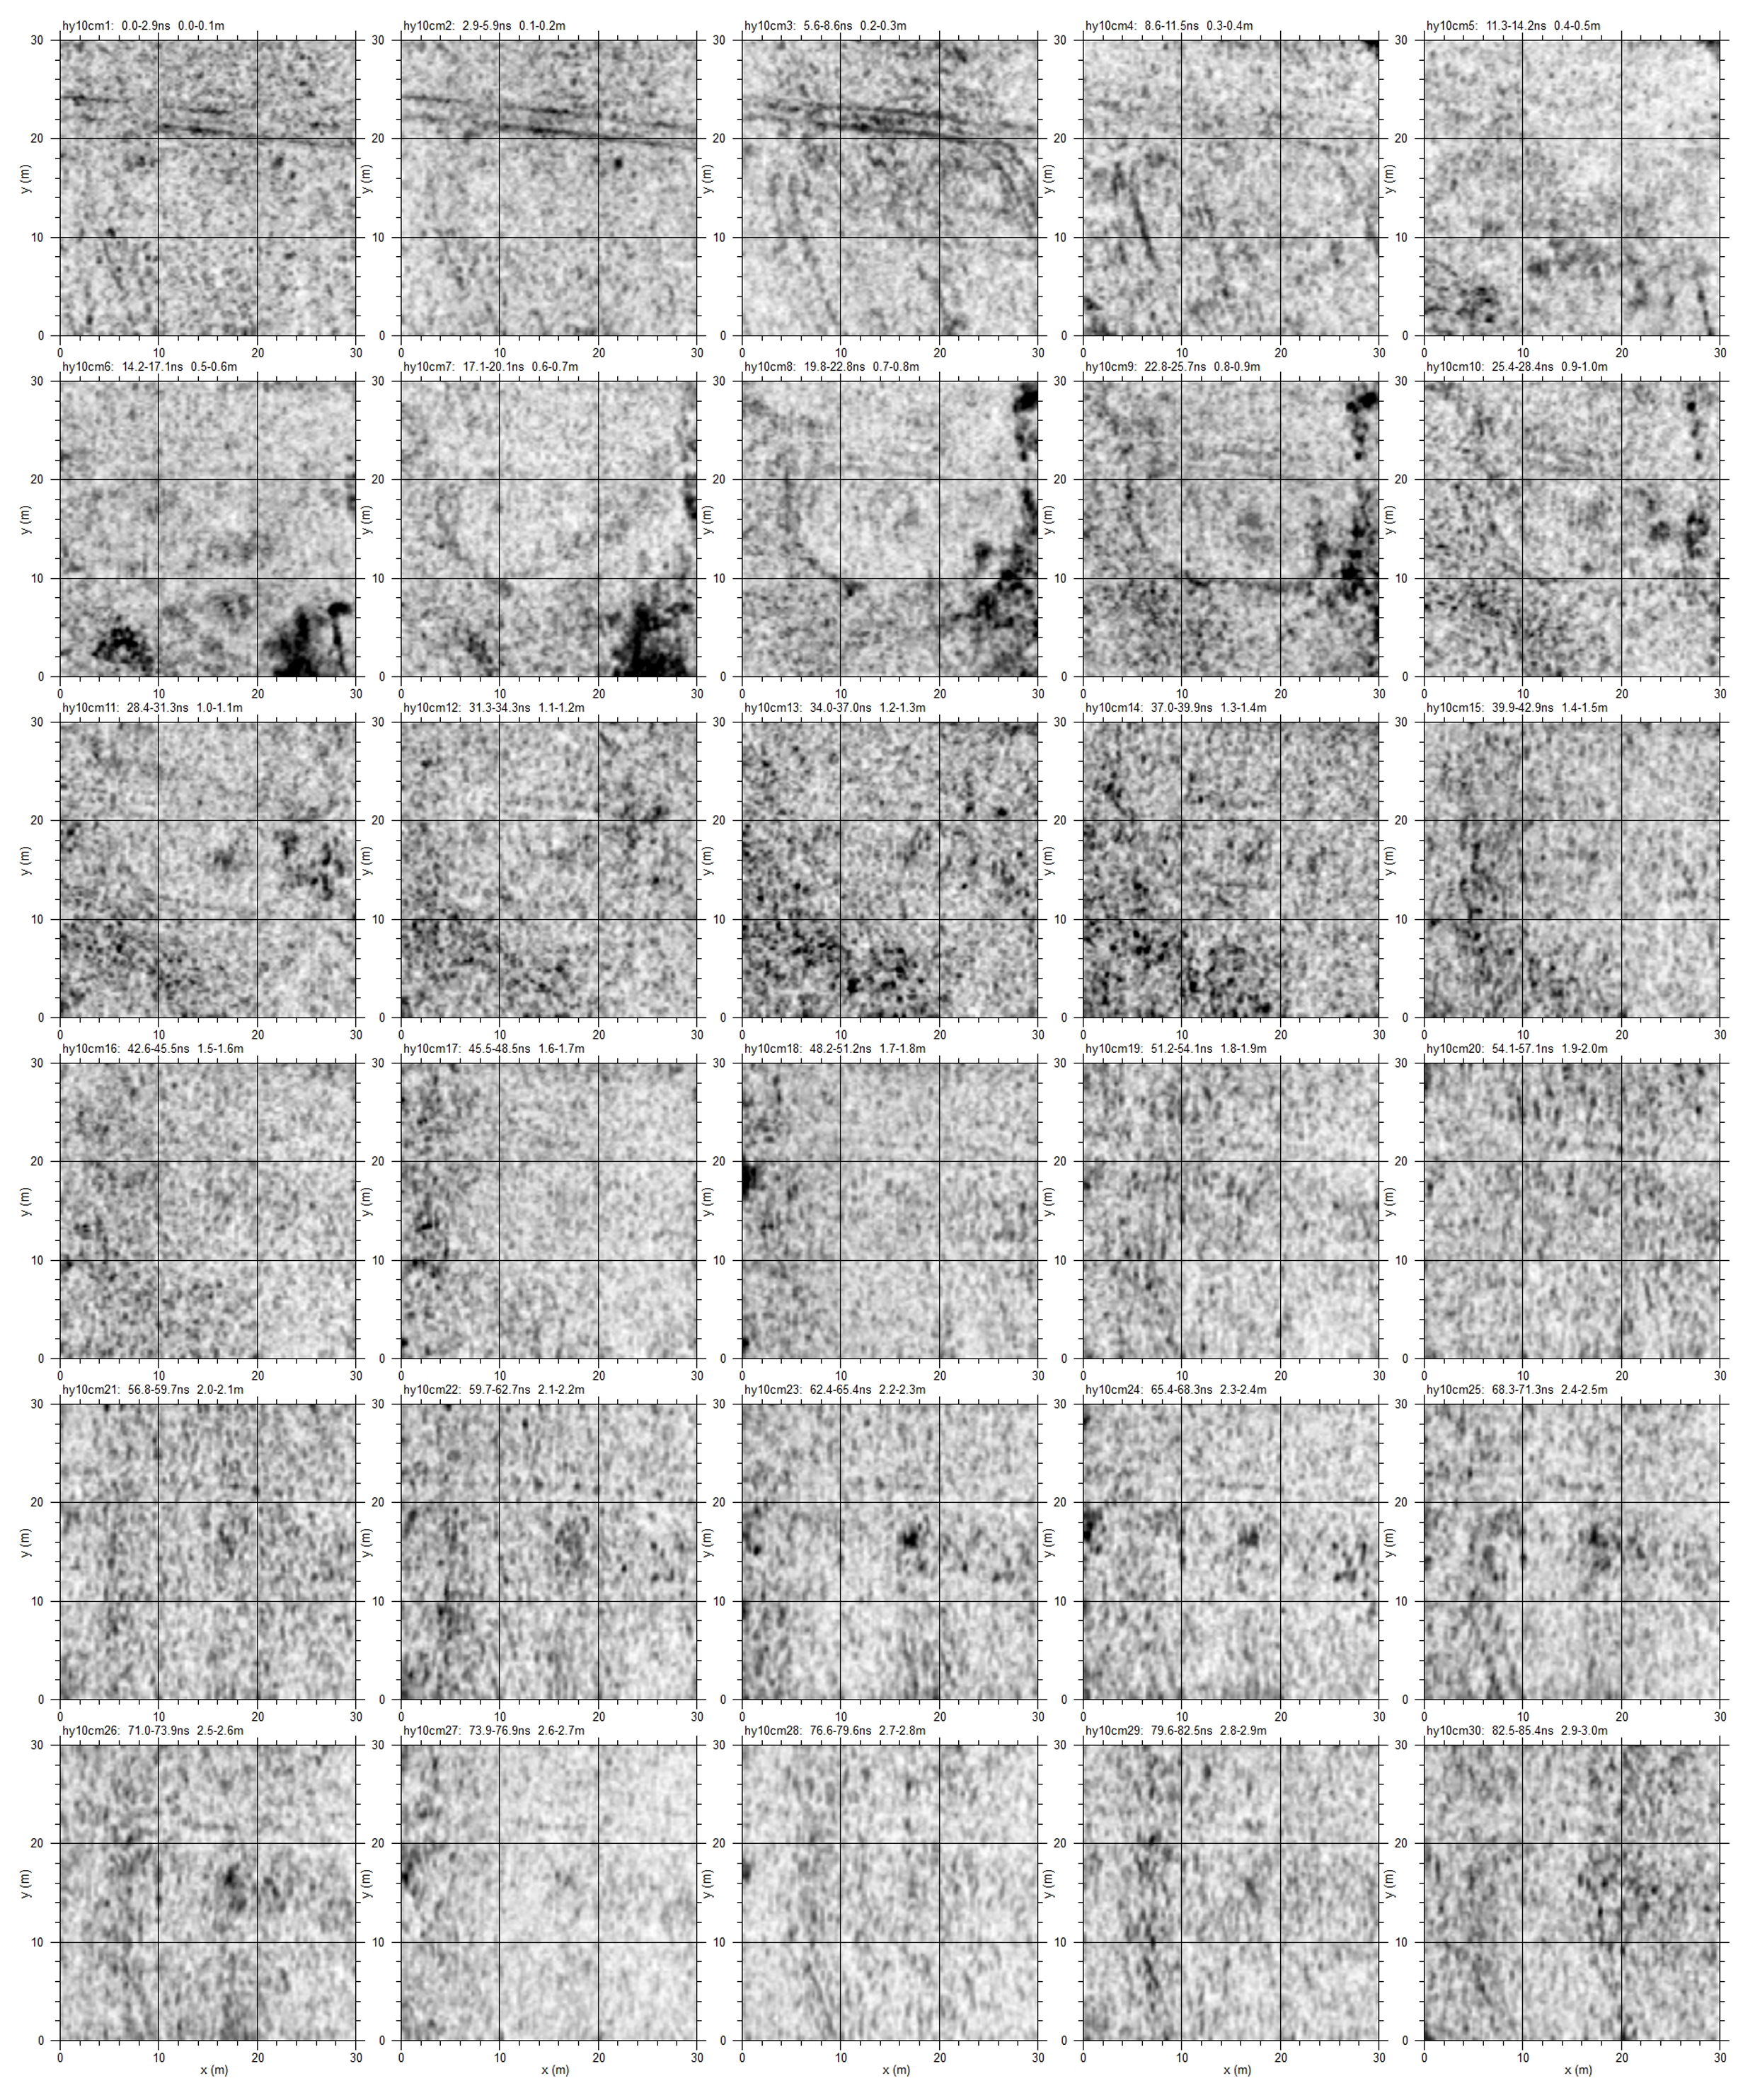
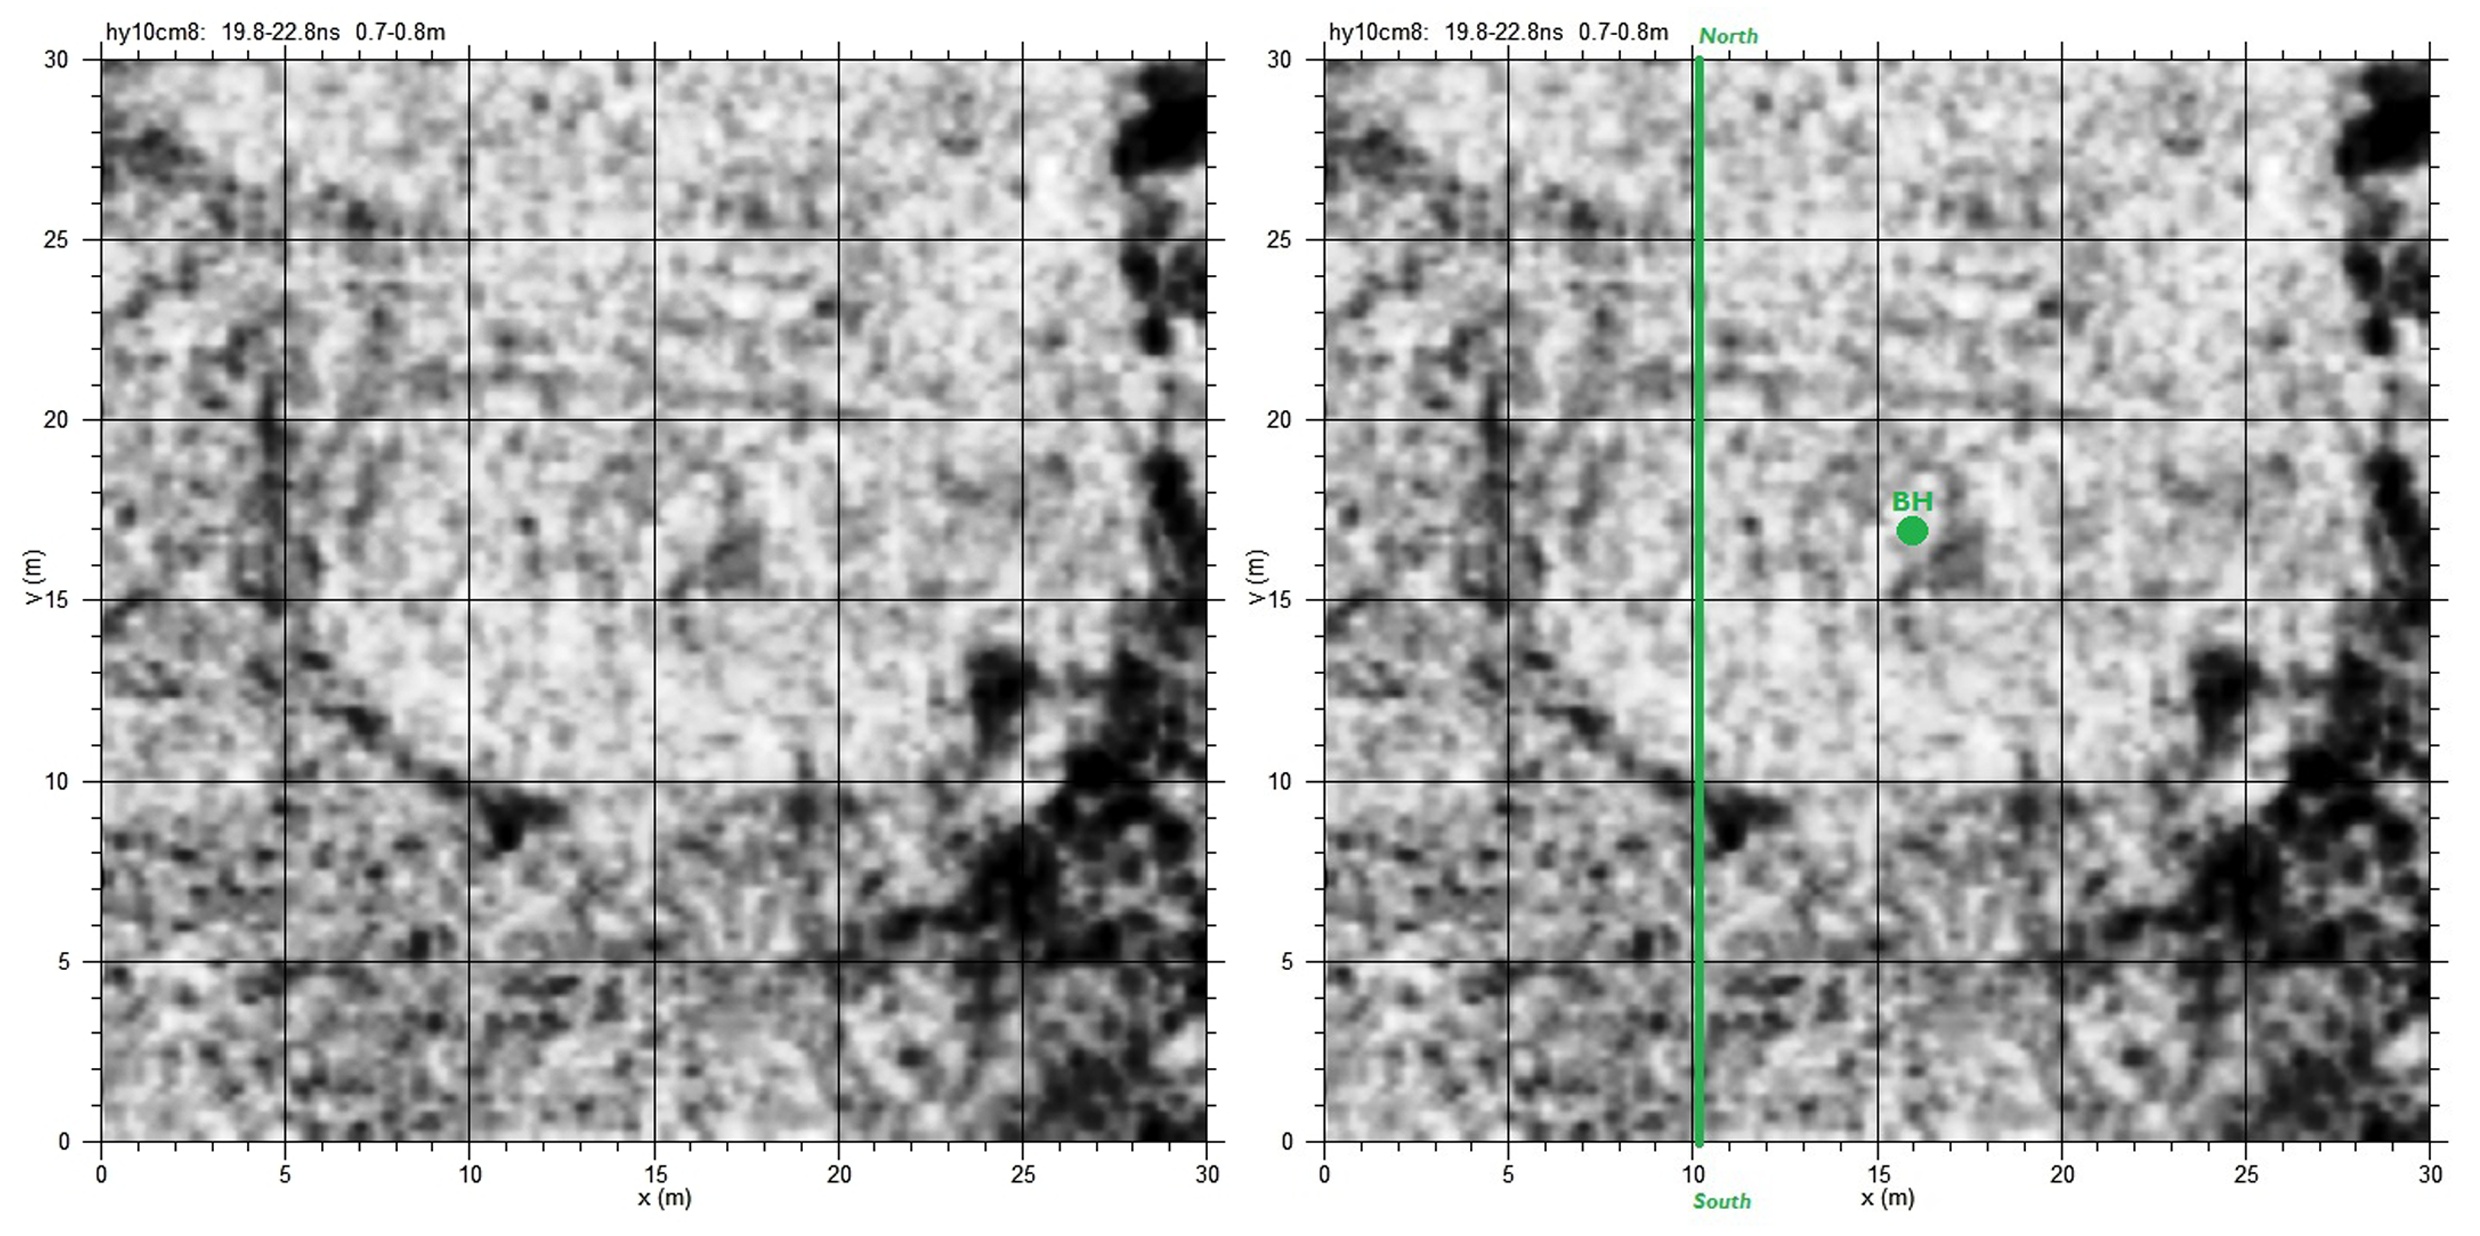
Time slices in Figure 2.7 identify an elliptical feature directly beneath the topsoil. The data indicate an identifiable weathering cone with a near circular central feature. Paradoxically, the near-surface plough marks are seen at depth throughout the time slices and presumably are a result of 'ringing' resulting from the recent heavy rain. The bottom of the feature is not identifiable. The weathering cone and central feature are also discernible in profile (radargram 2130 – Figs 2.8 and 2.9). Within the weathering cone, a reflective horizontal layer is evident (effectively 'sealing' the central feature beneath). A distinctive break in a deeper underlying geological response, which coincides with the position of the central cut feature above, is visible at c.2m depth.
This feature was previously identified following an LBI ArchPro magnetometer survey in 2013 as part of the Stonehenge Hidden Landscape project (see Gaffney et al. (2020, supplementary data 1).
A 250MHz GPR survey was conducted over 2A in a north–south orientation (with zigzag method) and at a traverse spacing of 0.25m. Figure 2.10 shows time slices at increasing depth down through the topsoil. The results reveal a slightly irregular elliptical feature (c.20m in diameter) cutting into the underlying geology, to an estimated depth of between c.0.6m–1.2m. This feature seems to decrease in diameter with depth, indicating possible modification or erosion through natural processes.
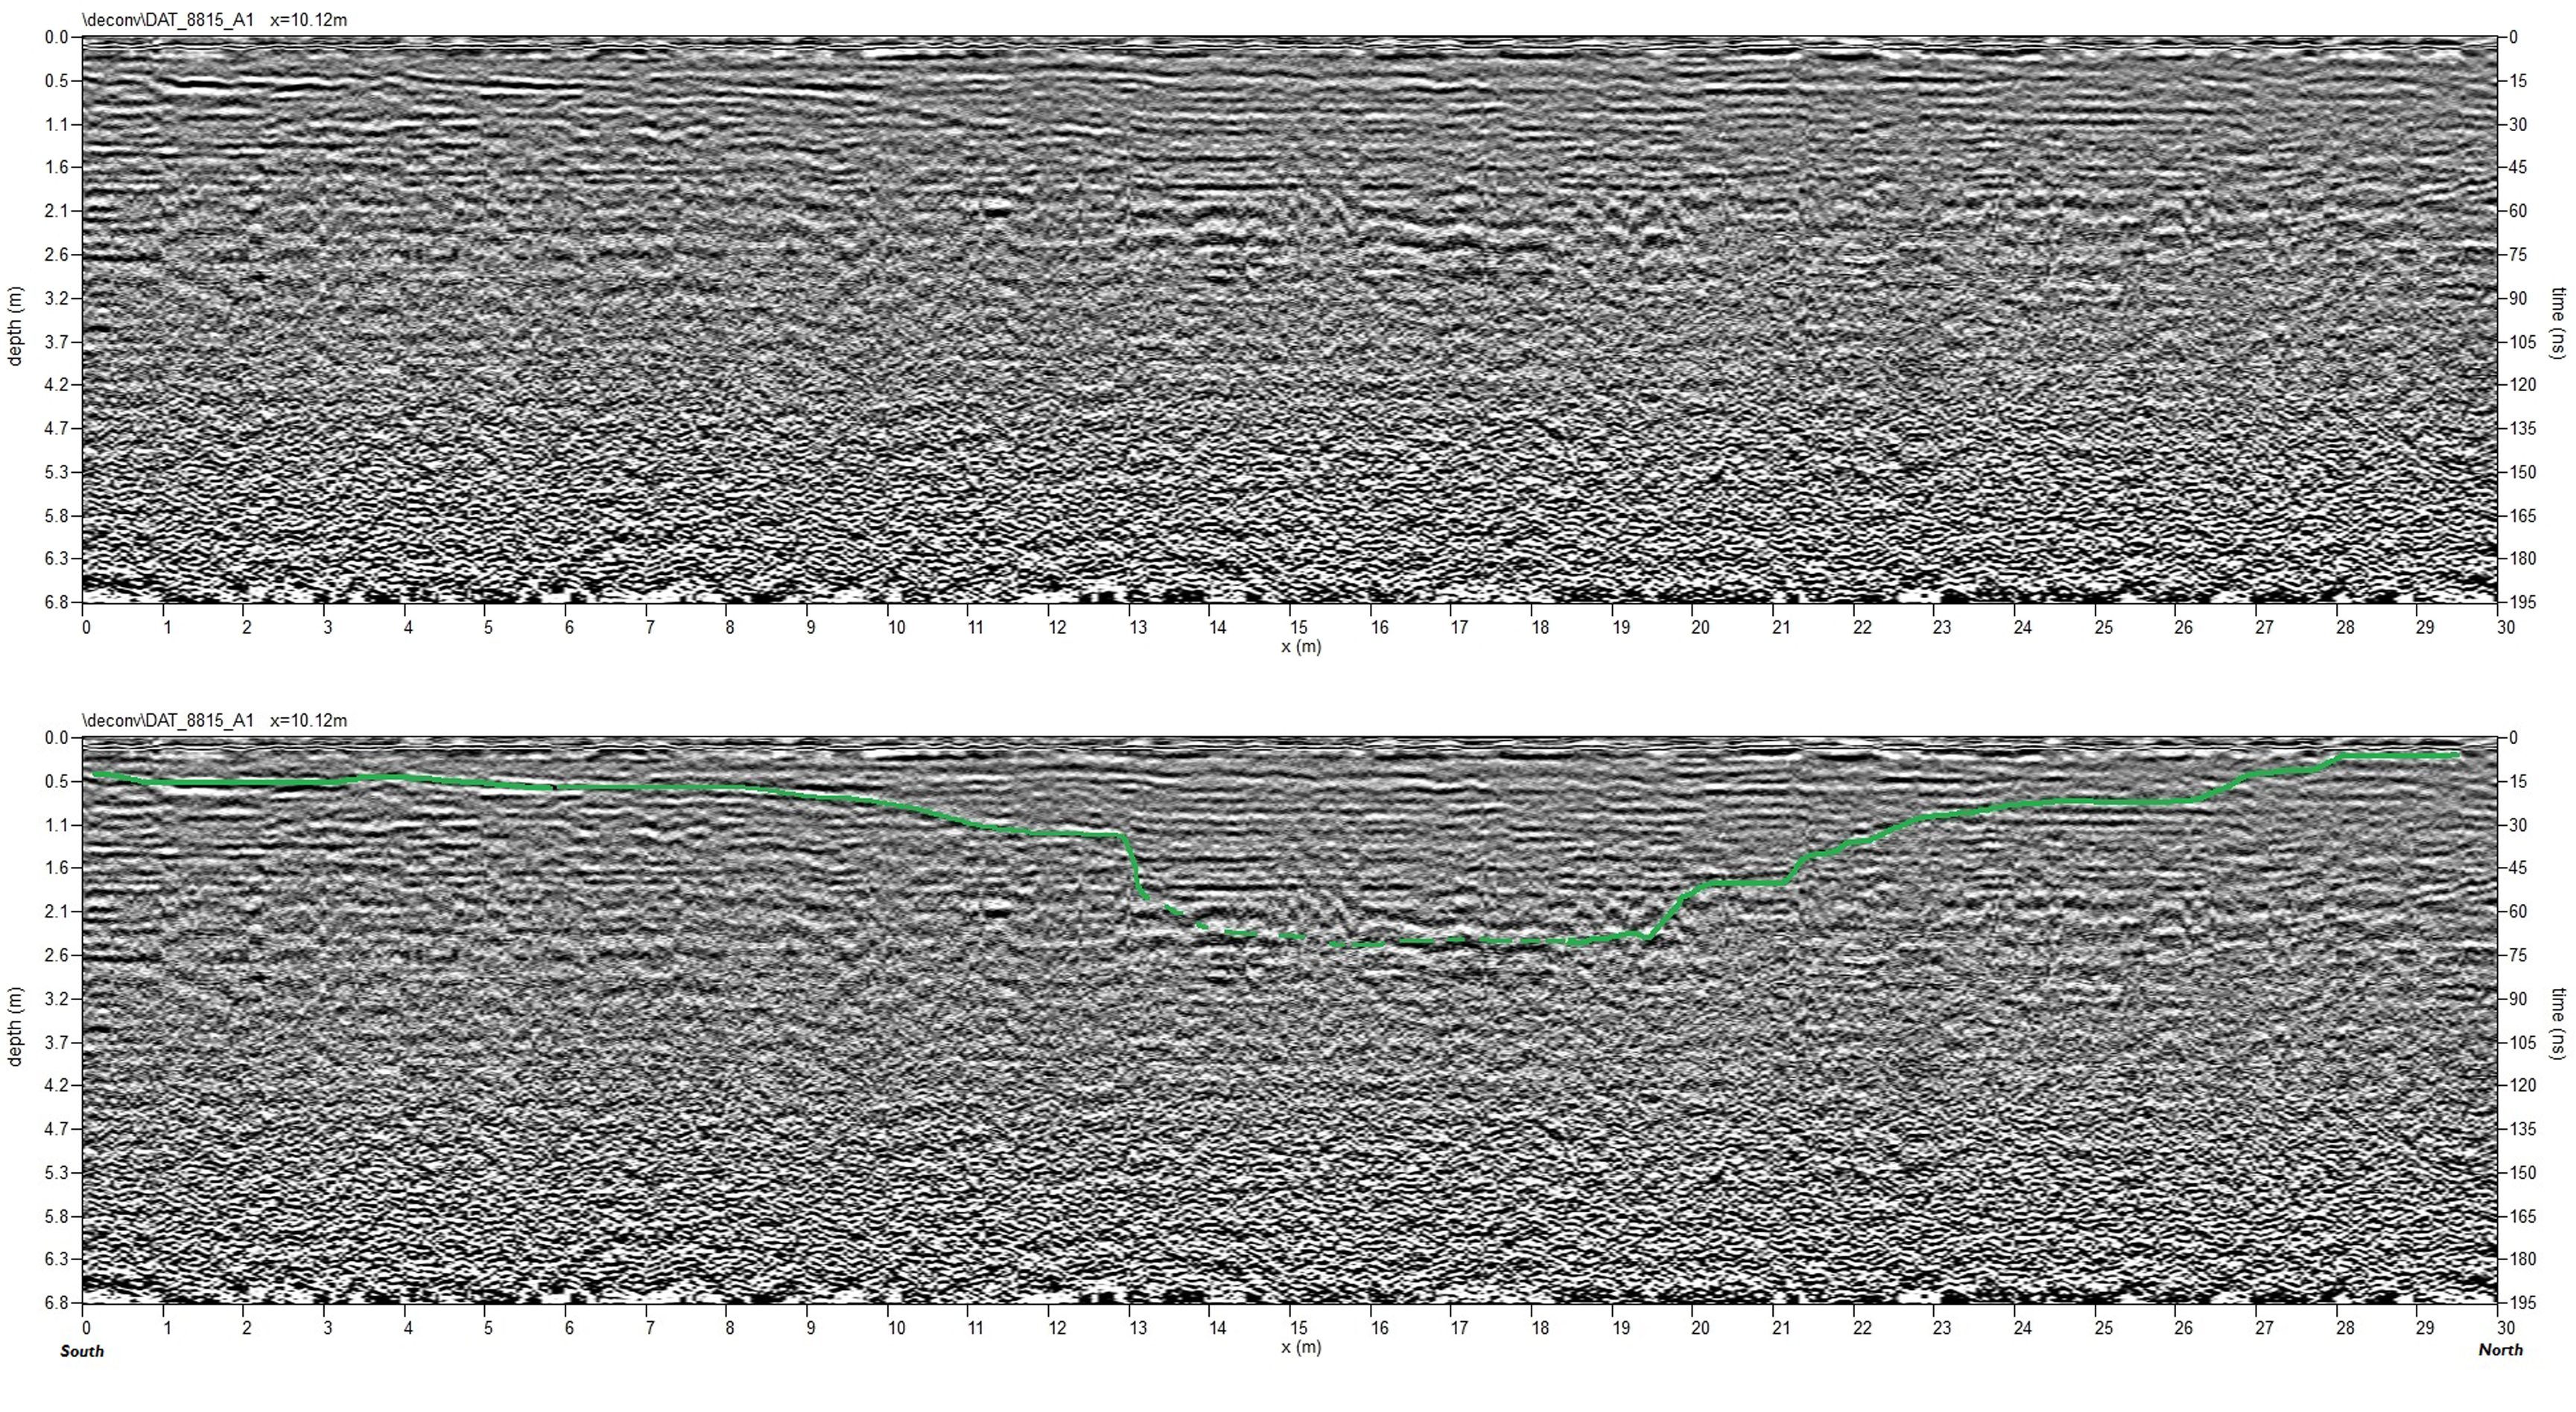
Although the weather was dry during the survey, a combination of recent rain and a high clay content of the underlying subsoil may have limited the penetration of the radar signal. Analysis of radargram 8815 (Figs 2.11 and 2.12), however, suggests deeper responses within the feature are discernible in the profile down to c.3m, including a significant interface evident as a highly reflective layer response at c.2.2–2.8m depth.
Similarly, the time slice data suggest disturbances located centrally within the feature at an estimated depth of c.2.2m–2.7m. It is not clear if these responses reflect natural or anthropogenic features. The bottom of the feature is not identifiable in the GPR data.
Elsewhere within the survey data, linear vehicle tracks on the soil surface are evident in the uppermost time slices and these have also caused multiple signals to reappear at depth – they do not represent original features.
This feature was previously identified through an LBI ArchPro magnetometer survey in 2013 as part of the Stonehenge Hidden Landscape project (see Gaffney et al. (2020 , supplementary data 1).
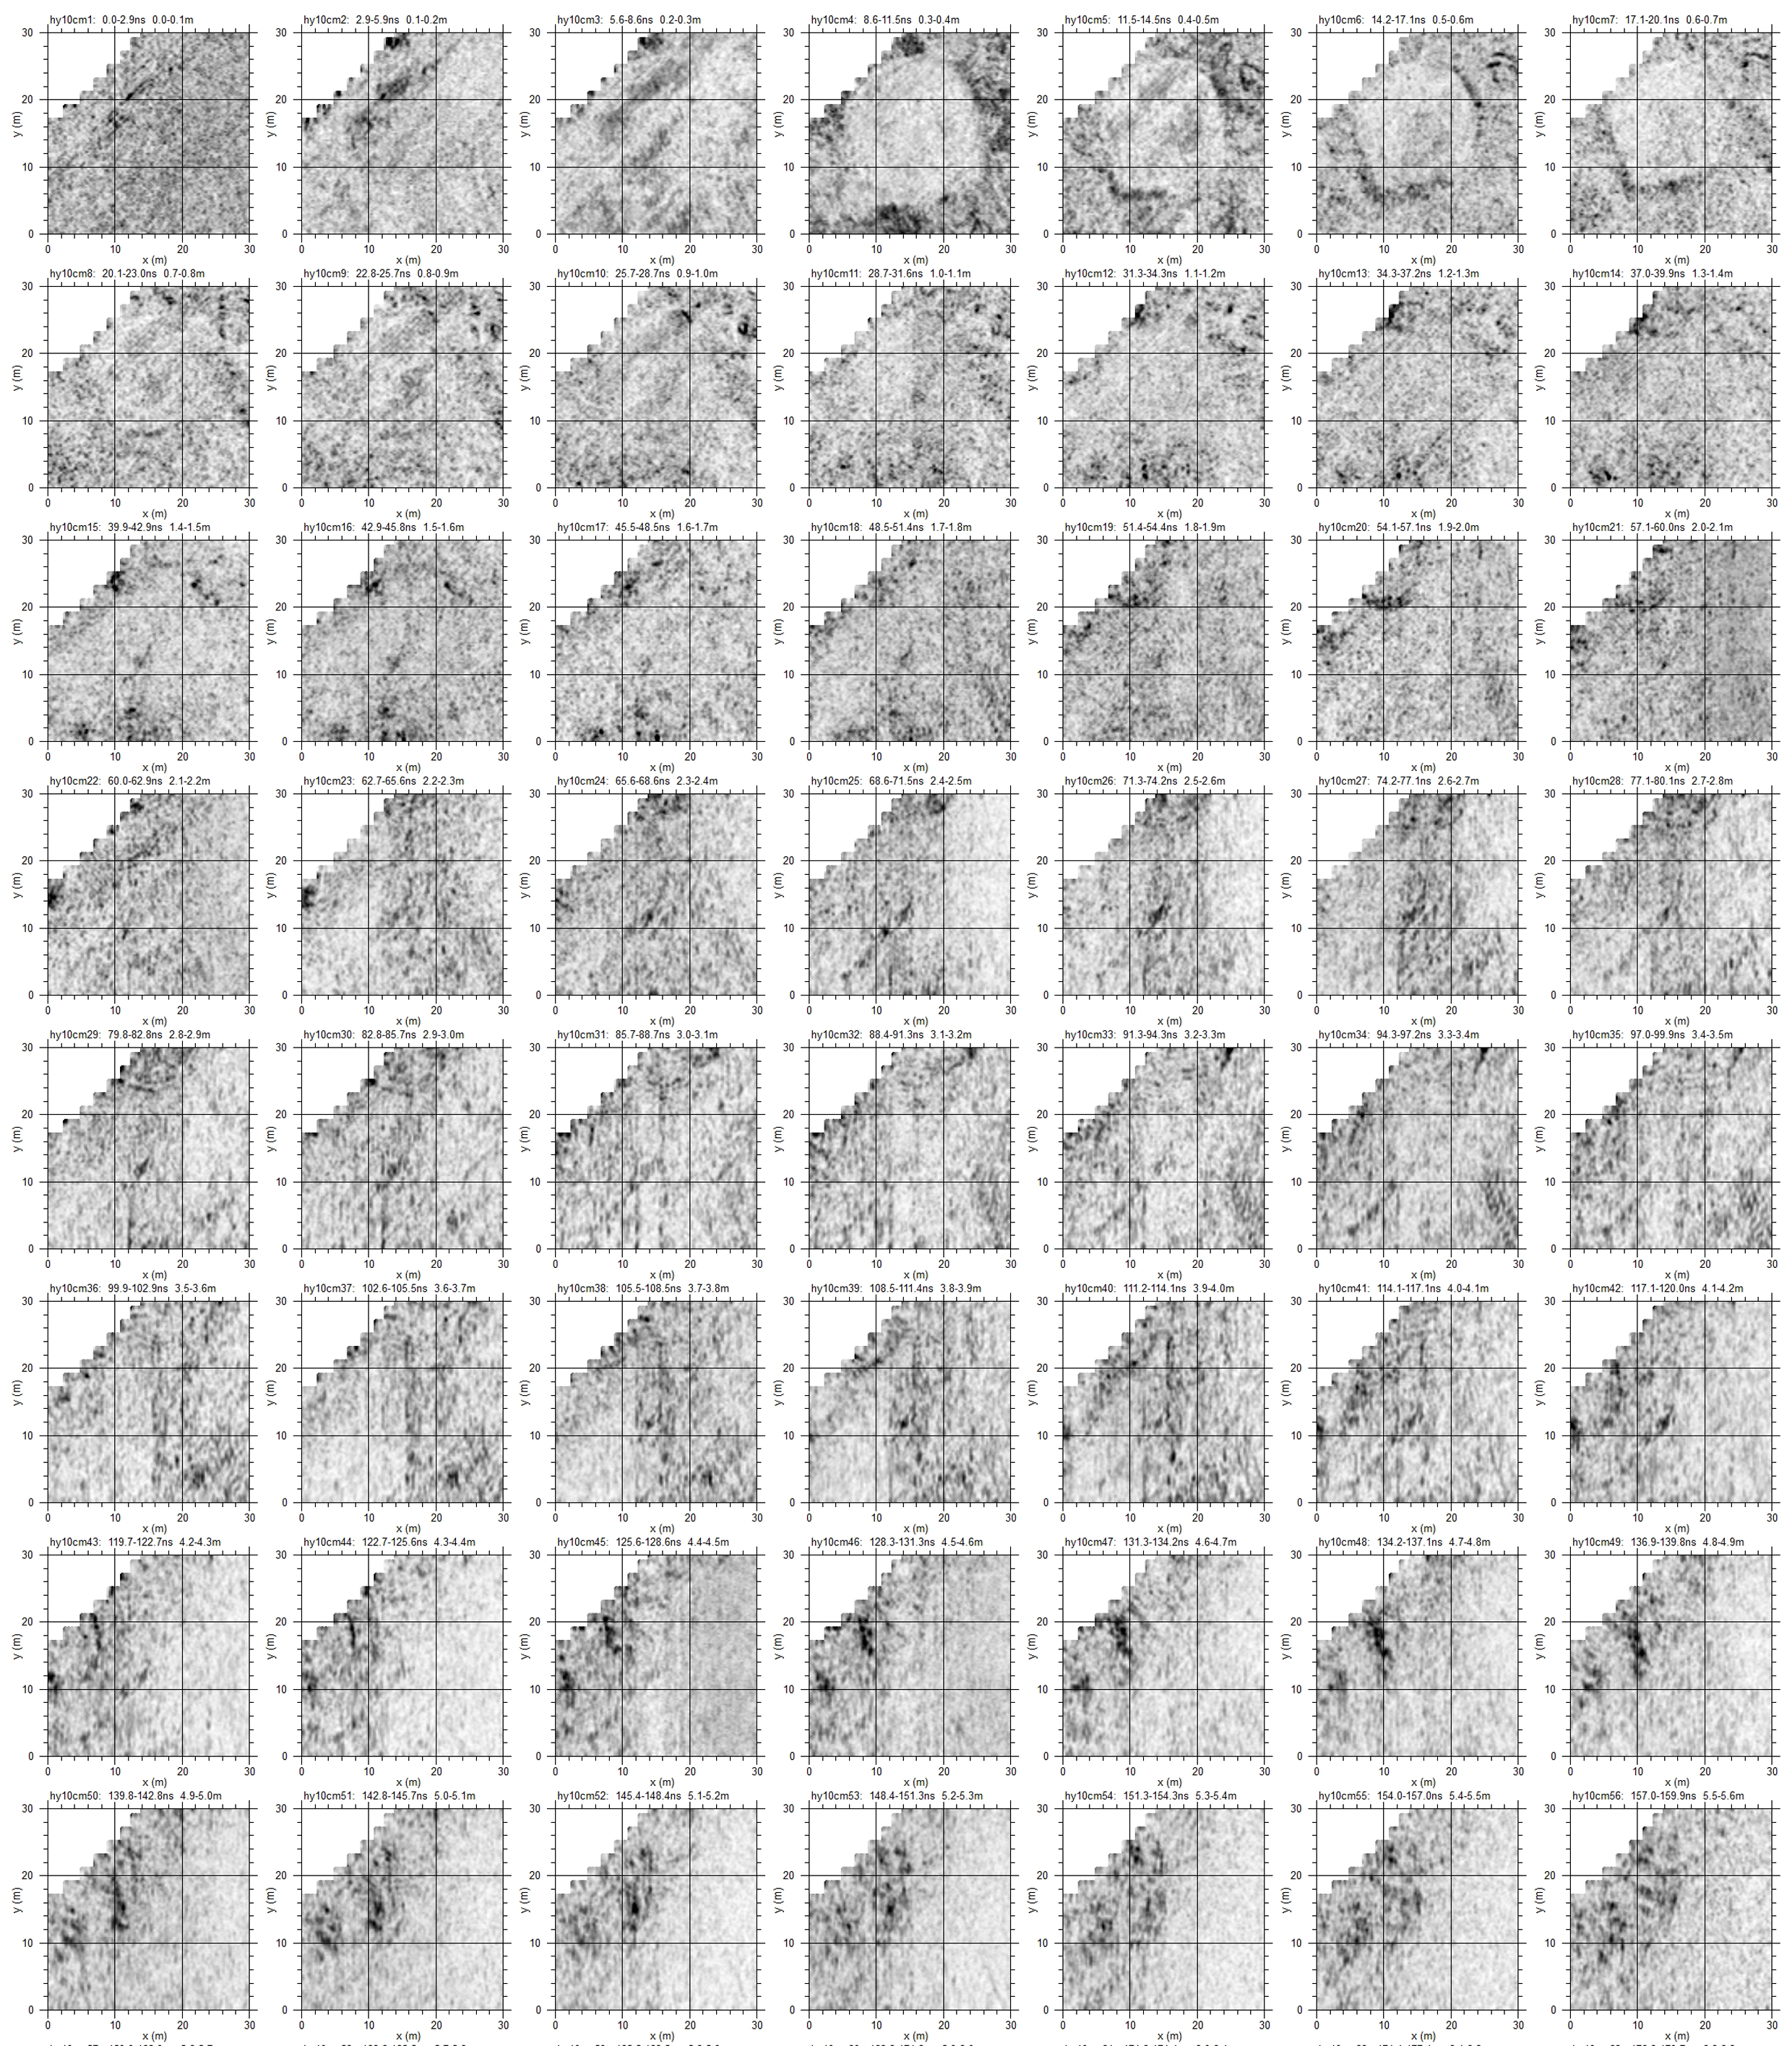
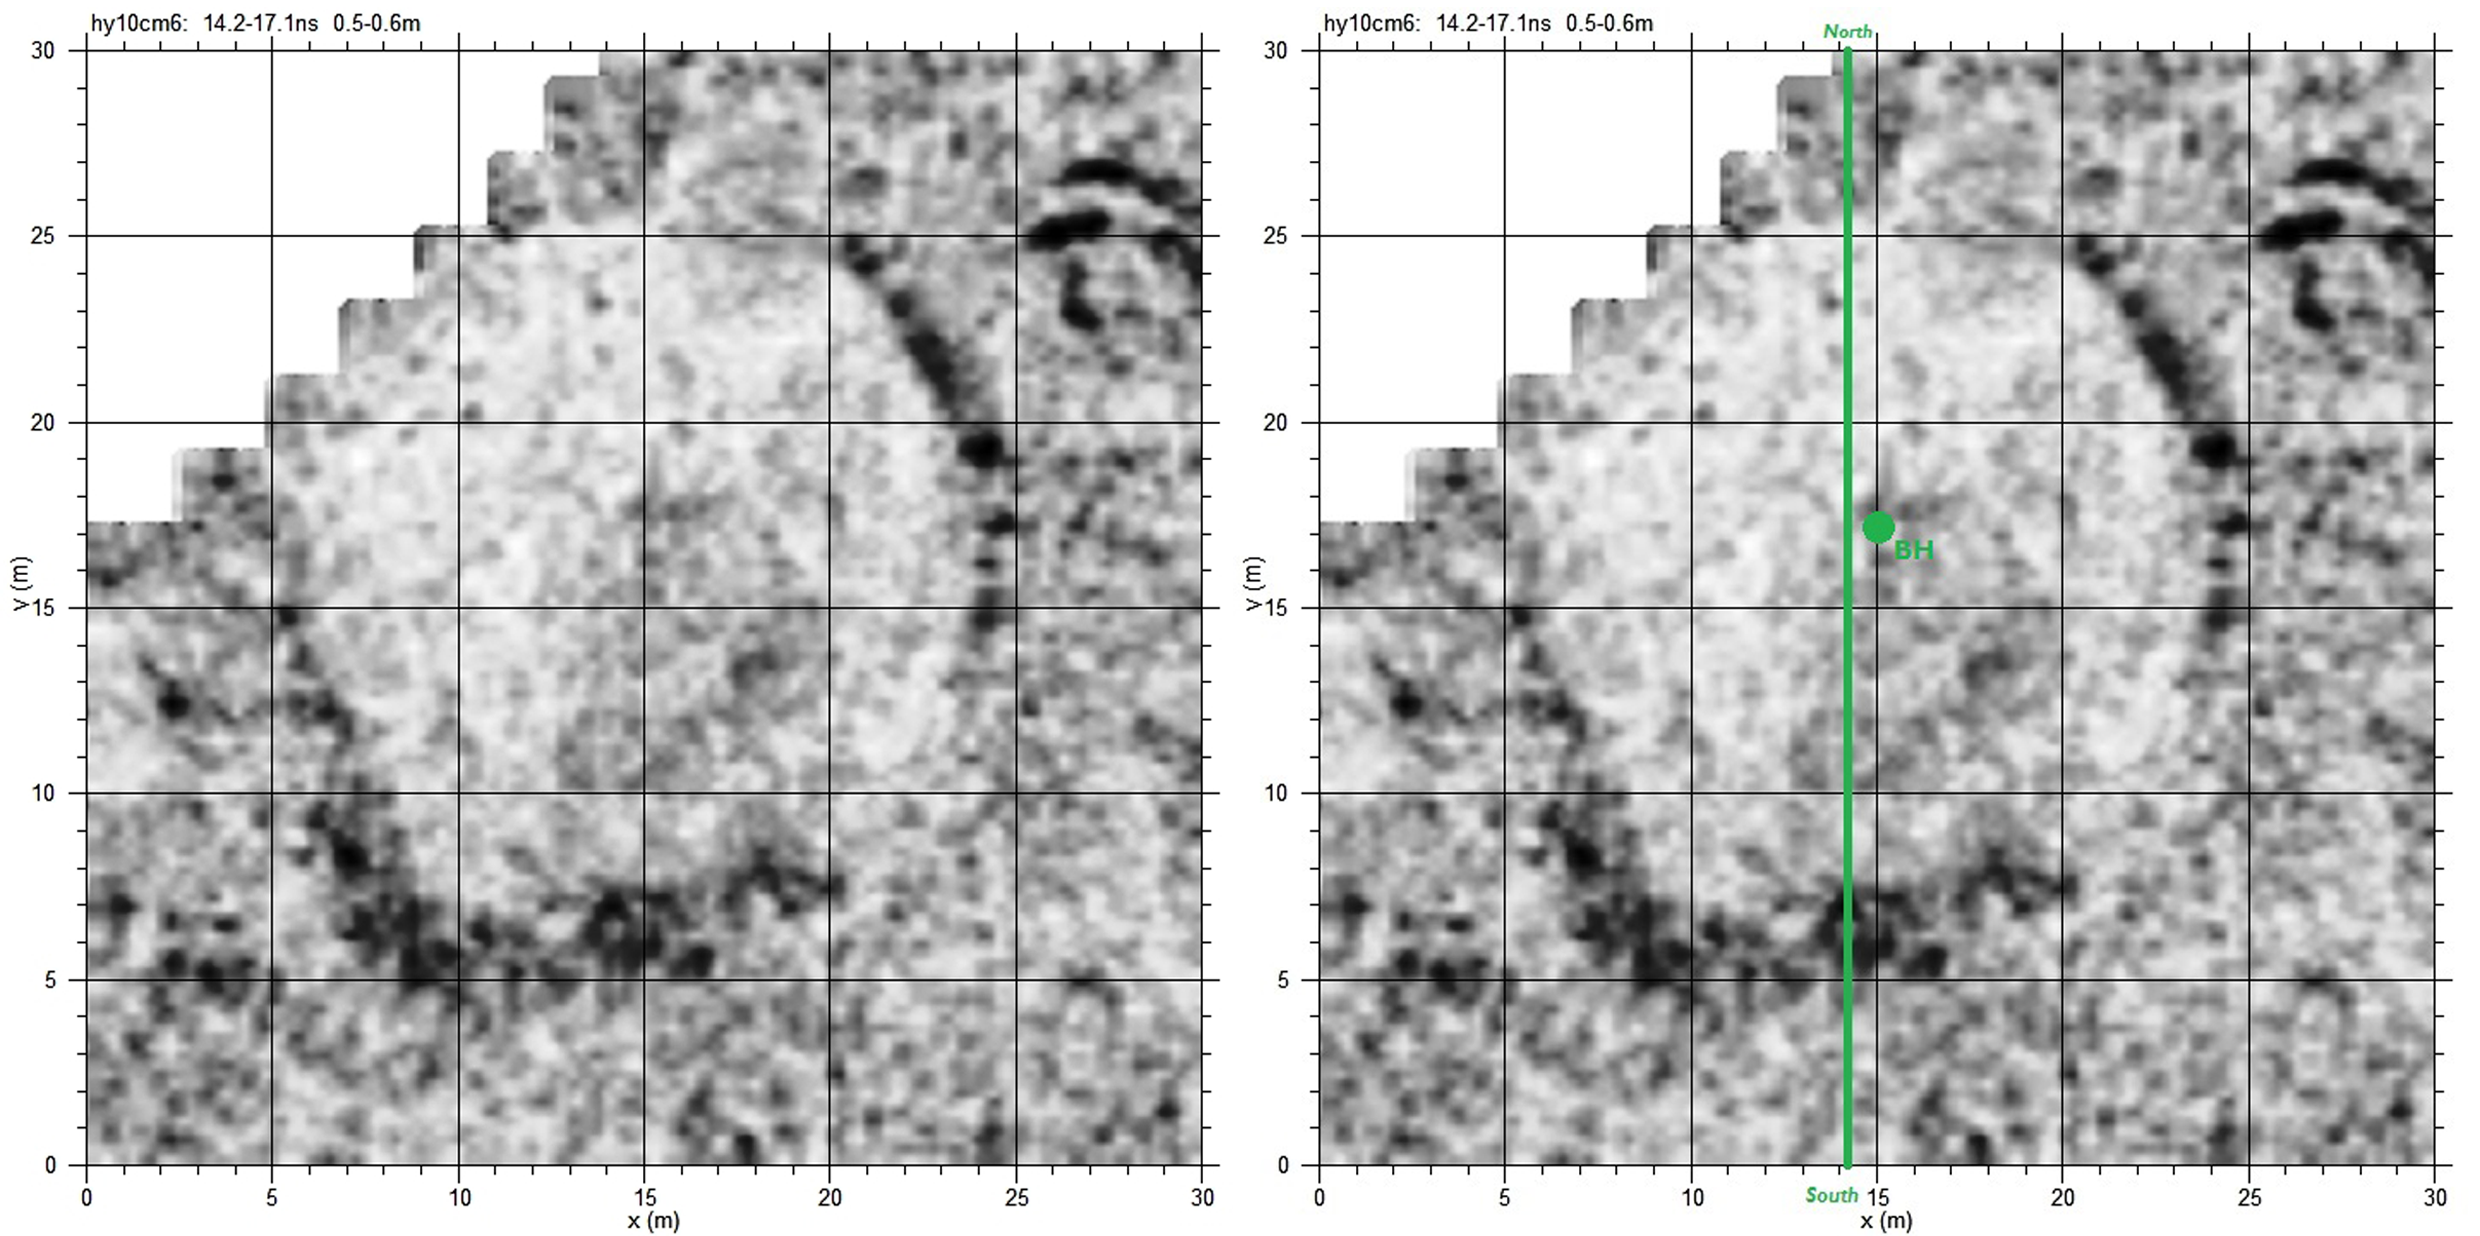
A 250MHz GPR survey was conducted in north–south orientation (with zigzag method) over 3A and a traverse spacing of 0.25m. Figures 2.13 and 2.14 show time slice maps at increasing depth down the topsoil. The results reveal a distinctly ovate feature (c.20m in diameter) cutting into the underlying geology, with an estimated depth of between c.0.4m–1.3m. This feature seems to decrease in diameter with depth, indicating possible modification or erosion through natural processes. Some internal features may be present. The bottom of the feature is not identifiable in the GPR data.
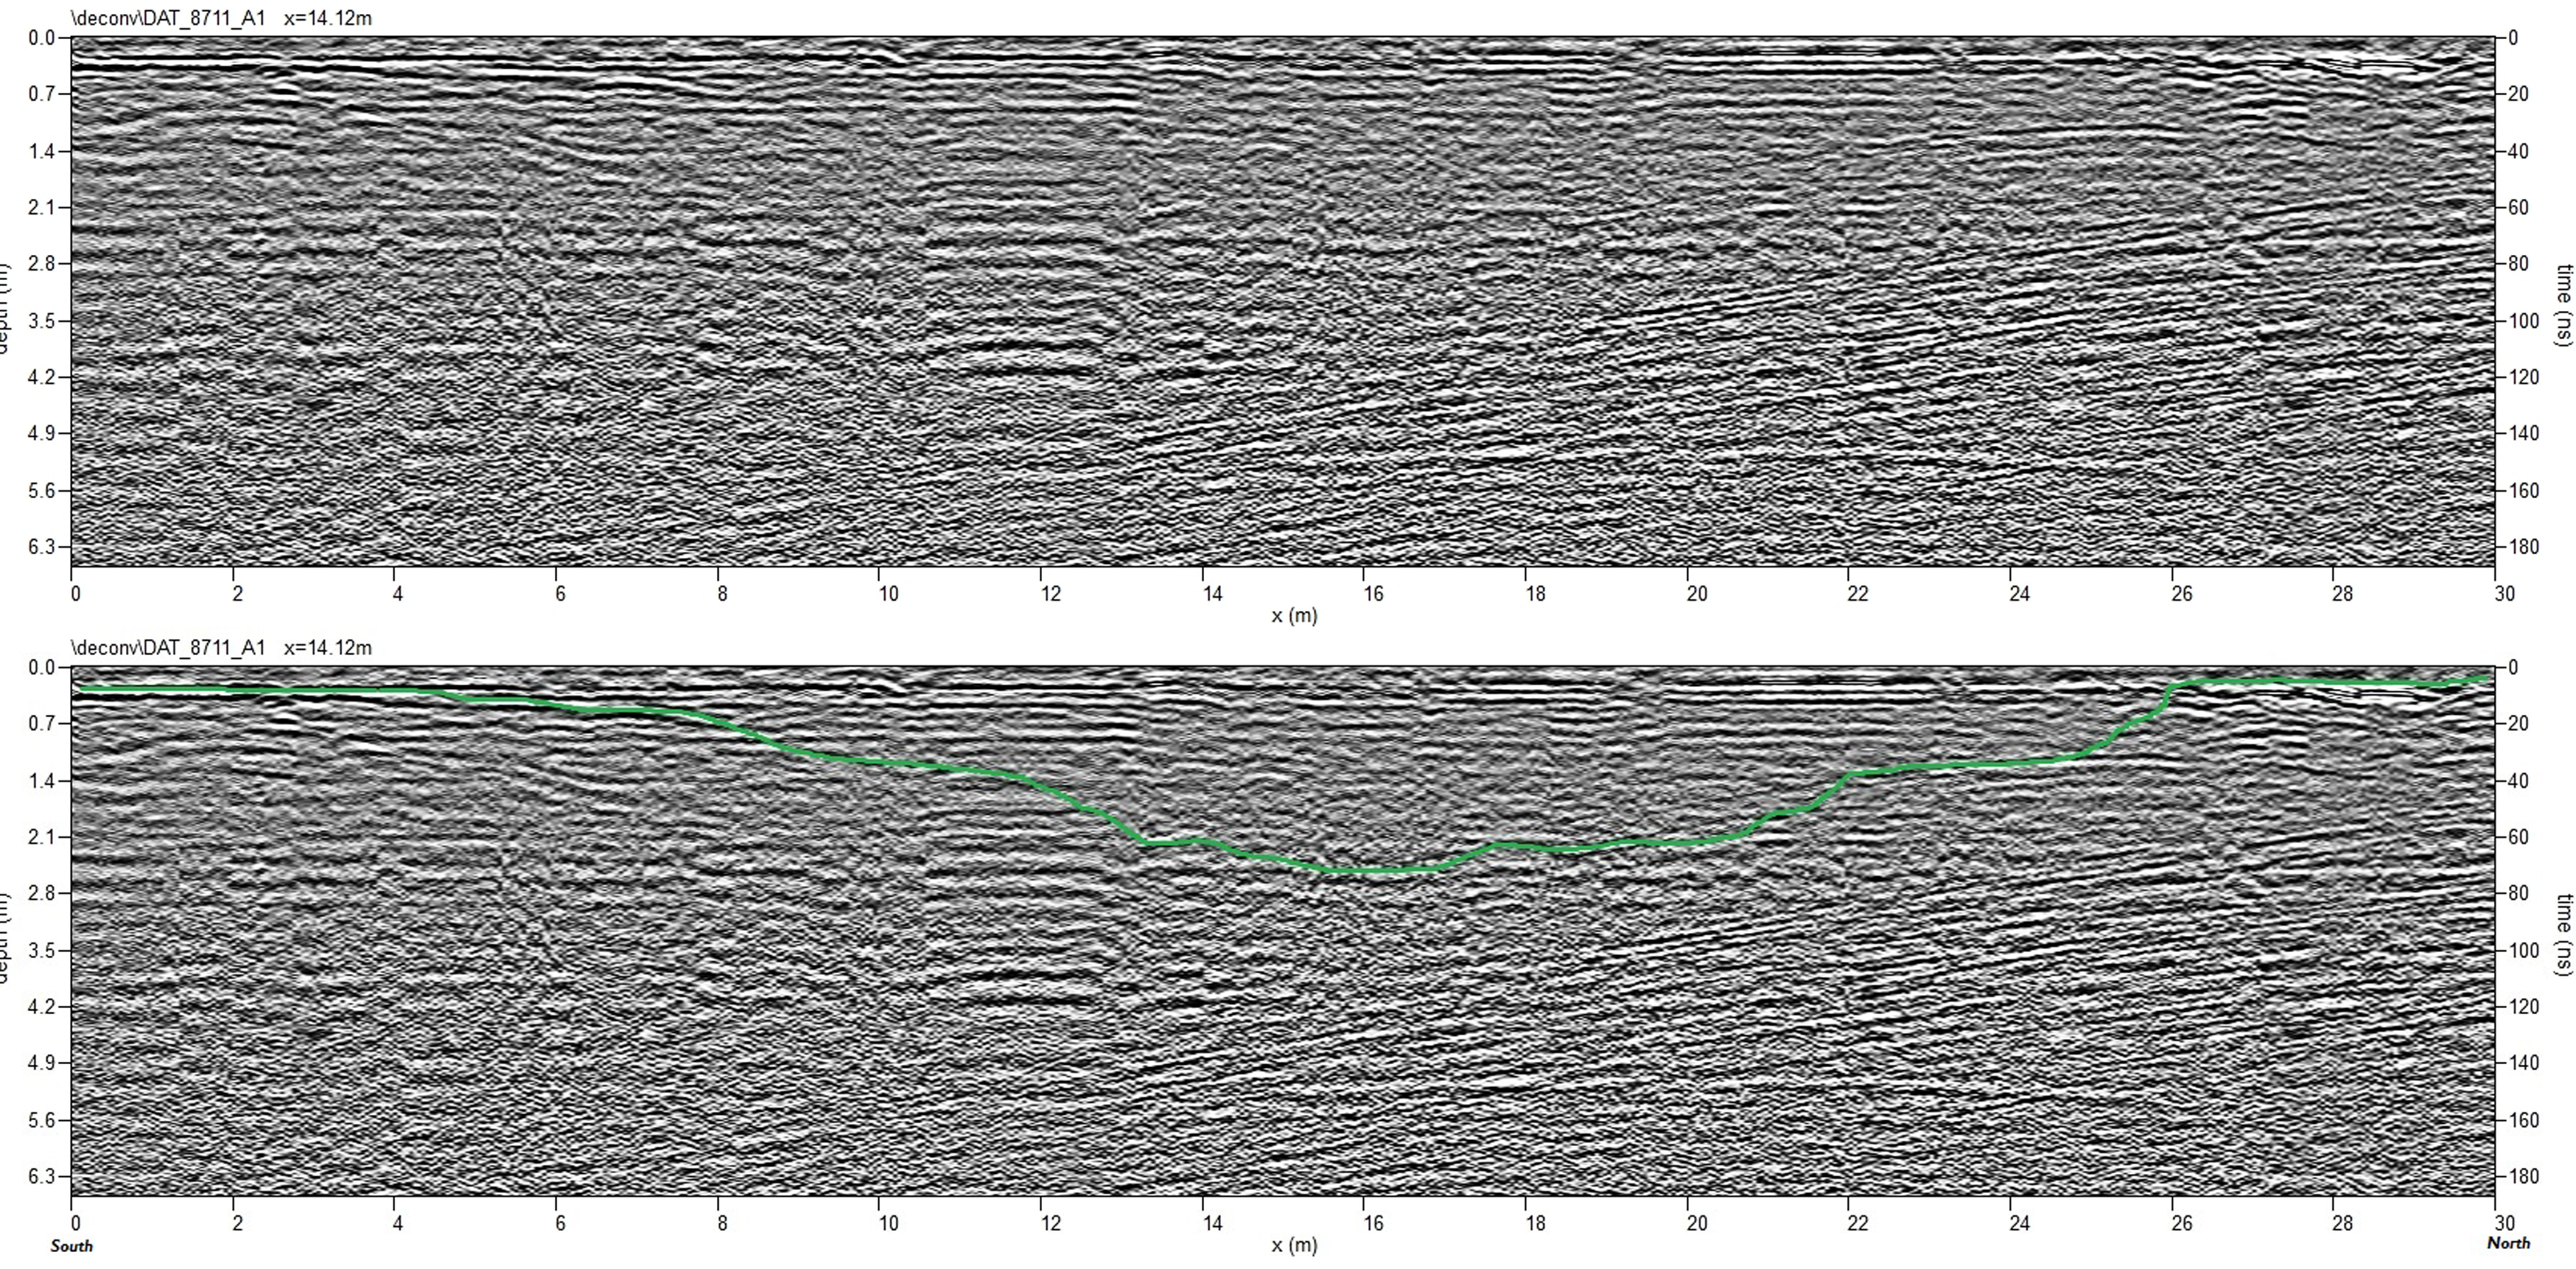
A combination of recent rain and the high clay content of the underlying geology (see Section 1.1 and Fig. 2) may have limited the penetration of the radar signal. Nonetheless, radargram 8711 (Fig. 2.15) suggests some deeper responses are visible in profile down to c.2.5m.
In summary, the GPR surveys were successful in providing supporting evidence for all five features surveyed. However, responses were usually limited to a relatively shallow depth (c.0.3m–1.5m depth), and the dimension of the features recorded, c.18–20m in diameter, suggest that these probably represented the weathering cones of deeper features. Where ground and weather conditions were more conducive to survey, the results from 1A, 2A, and 3A further indicate the presence of a narrower central feature with diameter of c.8–12m. Unfortunately, the loss of meaningful response after c.3m meant that the GPR was unable to detect the bottom of any feature.
Internet Archaeology is an open access journal based in the Department of Archaeology, University of York. Except where otherwise noted, content from this work may be used under the terms of the Creative Commons Attribution 3.0 (CC BY) Unported licence, which permits unrestricted use, distribution, and reproduction in any medium, provided that attribution to the author(s), the title of the work, the Internet Archaeology journal and the relevant URL/DOI are given.
Terms and Conditions | Legal Statements | Privacy Policy | Cookies Policy | Citing Internet Archaeology
Internet Archaeology content is preserved for the long term with the Archaeology Data Service (ROR). Help sustain and support open access publication by donating to our Open Access Archaeology Fund.
 Home
Home